
VIX Futures Curves: Trends and Volatility Charts
The VIX Index measures expected S&P 500 volatility over the next 30 days, but VIX futures allow traders to gauge and act on volatility expectations further out. These futures help manage risk, spot trading opportunities, and understand market sentiment. The shape of the VIX futures curve - whether upward (contango) or downward (backwardation) - reveals market expectations about volatility trends.
Key takeaways:
- Contango: Common in stable markets, reflects higher prices for longer-dated futures, offering opportunities for short-volatility strategies.
- Backwardation: Rare, signals market stress with higher near-term contract prices, favoring long-volatility positions.
- Historical data shows contango dominates 81% of the time, while backwardation occurs during crises like 2008 or 2020.
- Seasonal trends impact volatility, with July typically calm and October more volatile.
- Tools like exponential moving averages (EMA) and polynomial fitting can refine trading signals, offering improved performance over basic strategies.
For traders, platforms like TraderVPS enhance VIX analysis by ensuring fast, reliable execution, critical for acting on fleeting market opportunities.
The VIX Futures Curve
Contango and Backwardation in VIX Futures
VIX Futures Curves: Contango vs Backwardation Comparison
The shape of the VIX futures curve provides a snapshot of what traders anticipate for market volatility in the weeks and months ahead. Two primary patterns emerge: contango and backwardation. Each offers a unique perspective on market sentiment and opens up distinct trading opportunities. Let’s start with contango, the more frequently observed structure.
Understanding Contango
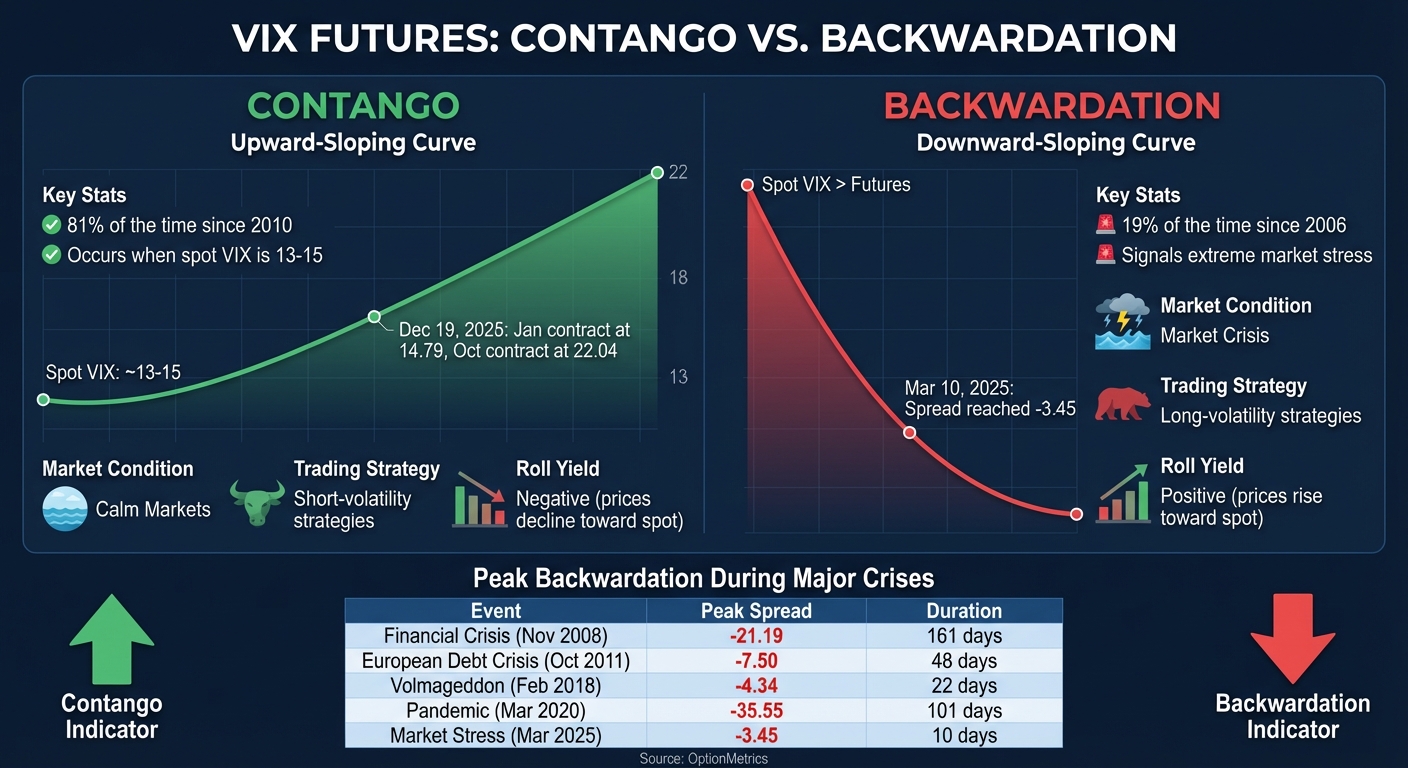
Contango refers to an upward-sloping curve where longer-dated VIX futures are priced higher than shorter-dated ones. Since 2010, this structure has appeared over 80% of the time [8]. When the spot VIX hovers around 13 to 15, traders often expect volatility to rise back toward its long-term average of around 20, which pushes prices for distant contracts higher.
For instance, on December 19, 2025, the VIX term structure displayed a classic contango pattern. The January 16, 2026, contract traded at 14.79, while the October 16, 2026, contract climbed to 22.04, forming a steady upward slope across ten monthly maturities [10]. This setup reflects a calm market where participants foresee a gradual return to average volatility levels.
One notable feature of contango is the roll-down effect, which benefits traders who take short-volatility positions. As contracts approach expiration, their prices typically converge toward the spot VIX. This downward drift, known as negative roll yield, can erode the value of long volatility products like VXX, even if the VIX Index itself remains unchanged [4].
"VIX futures contango is typically the steepest when the spot VIX Index is extremely low." – Scott Bauer, Senior Director at Cboe Options Institute [8]
Understanding Backwardation
Backwardation, on the other hand, arises when near-term contracts trade at a premium to longer-dated contracts, creating a downward-sloping curve. This structure is far less common, occurring in just 19% of cases since February 2006 [9], and is often a sign of heightened market stress.
"VIX futures backwardation is rare, and usually only occurs during periods of extreme financial stress." – Brett Friedman, Winhall Risk Analytics [5]
A recent example occurred in March 2025, when the VIX futures curve entered backwardation for 10 trading days between March 3 and March 10. On March 10, the spread between the 30-day and 180-day contracts reached -3.45, marking the first time backwardation surpassed -3.00 since the 2020 pandemic [9]. This inversion reflected traders urgently seeking short-term protection, driving up premiums for front-month contracts.
Historical data underscores the intensity of backwardation during crises. For example:
- During the 2008 Financial Crisis, the curve reached a peak backwardation of -21.19 on November 20, 2008, and stayed inverted for 161 days.
- During the 2020 Pandemic, the curve hit an extreme -35.55 on March 18, 2020, lasting 101 days [9].
| Event | Peak Backwardation (30-Day – 180-Day) | Duration (Days) |
|---|---|---|
| Financial Crisis (Nov 2008) | -21.19 | 161 |
| European Debt Crisis (Oct 2011) | -7.50 | 48 |
| Volmageddon (Feb 2018) | -4.34 | 22 |
| Pandemic (Mar 2020) | -35.55 | 101 |
| Market Stress (Mar 2025) | -3.45 | 10 |
Source: OptionMetrics [9]
Trading Strategies for Each Curve Type
The shape of the VIX curve plays a pivotal role in shaping trading strategies. Depending on whether the market is in contango or backwardation, traders can adjust their tactics to align with prevailing conditions.
- In contango, short-volatility strategies take advantage of the roll-down effect, as futures prices naturally decline toward the spot VIX. Traders often short VIX futures or use inverse products like SVXY to capitalize on this erosion [4]. However, these strategies come with significant risks - unexpected market shocks can cause sharp VIX spikes, wiping out accumulated gains.
- In backwardation, long-volatility strategies can benefit from positive roll yield [4]. Timing is crucial, though, as an inverted curve signals elevated market risk. According to Cheddar Flow, backwardation often represents peak fear, making it a good moment to reassess portfolio exposure rather than chase short-lived momentum [1].
For example, in March 2018, when President Trump announced tariffs on steel and aluminum, the VIX spiked to 24.87 on March 22. The futures curve inverted sharply as demand for immediate protection surged. However, the backwardation was short-lived, reverting to contango within weeks once trade negotiations began [1].
The relationship between the VIX level and the curve’s slope also follows predictable patterns. When 30-day VIX futures trade below 12, the average spread relative to 182-day futures is approximately -3.42, indicating steep contango. Conversely, when the VIX exceeds 40, the spread flips to about +10.59, signaling deep backwardation [5]. These extremes often suggest that the prevailing trend may be nearing its end.
Historical Trends in VIX Curves
What Historical Data Shows
Looking at historical trends, the VIX curve has been in contango 81% of the time compared to 19% in backwardation [11]. This reflects a general market expectation that volatility tends to revert to its long-term average of around 20 [4].
When 30-day VIX futures dip below 12, the average spread to 182-day futures is approximately -3.42. On the other hand, when the VIX exceeds 40, the spread flips to +10.59, often signaling an impending volatility spike [5]. These patterns offer traders valuable insights, helping them anticipate potential shifts when similar conditions arise. Seasonal variations also play a role in shaping these dynamics, as outlined below.
Seasonal Patterns in VIX Curves
Seasonal trends have a notable impact on volatility behavior. Data going back to 1996 shows that July typically sees the lowest VIX levels, while October experiences the highest [5]. This seasonal rhythm provides traders with a roadmap: quieter summer markets often lead into more turbulent autumn conditions.
"Summer months tend to have depressed VIX levels, with July being on average the lowest month of the year (the highest is October)." – Brett Friedman, OptionMetrics Contributor [5]
While these patterns don't guarantee specific outcomes, they help traders strategize. For instance, recognizing July's typical calm can guide entries into volatility-sensitive trades, while October's historical spikes may prompt reassessments of risk exposure and the use of protective measures.
VIX Behavior During Market Crises
Market crises leave a distinct mark on the VIX curve, often flipping it into backwardation. The depth and duration of this inversion provide clues about the severity of market stress. During the 2008 Financial Crisis, the VIX curve stayed in backwardation for a record 161 consecutive days, with a peak spread of -21.19 on November 20, 2008. The 2020 pandemic saw an even sharper inversion, reaching -35.55 on March 18, 2020, though it lasted a shorter 101 days [11].
More recently, in March 2025, the curve entered backwardation for 10 trading days between March 3 and March 10, with a spread of -3.45. This marked the first time backwardation surpassed -3.00 since October 2020, signaling a brief but meaningful spike in near-term market fear [11]. The duration of these inversions is key - short-lived flips suggest temporary shocks, whereas extended backwardation points to deeper, more sustained market stress.
Reading Volatility Charts for Trading Signals
Let’s dive deeper into how volatility charts, particularly VIX charts, can provide critical trading insights by signaling potential market movements.
Main Elements of VIX Charts
To interpret VIX charts effectively, it’s important to understand their key components. The X-axis represents contract expiration dates, starting with the front-month and extending outward, while the Y-axis displays the prices of these contracts, which reflect expectations of future volatility [1][3].
The spot VIX index, shown as the leftmost point on the chart, represents the current 30-day implied volatility of the S&P 500. Its relationship with the front-month future offers a snapshot of immediate market sentiment [3][7]. The slope of the curve - whether it trends upward (contango), downward (backwardation), or remains flat - provides insight into whether traders anticipate volatility to increase or decrease [1][4]. Additionally, short-term spreads, such as the gap between the first and second month futures, can signal early shifts in market dynamics [7].
By familiarizing yourself with these elements, you’ll be better equipped to spot actionable signals embedded in the curve’s shape.
Spotting Trading Signals in VIX Curves
The transition between contango and backwardation is one of the most telling signals a VIX chart can offer. When the curve flips and near-term contracts become more expensive than longer-dated ones, it’s a clear indicator of heightened market risk [1]. This shift suggests immediate danger and calls for a reassessment of your market exposure [1].
Another signal to watch for is the flattening of the curve, which often reflects rising market anxiety and could precede a potential price drop [4]. To avoid being misled by short-term price spikes, traders often rely on tools like an exponential moving average (EMA) to confirm genuine changes in the curve’s slope [12].
"An inverted VIX futures curve is essentially the market screaming 'danger ahead – buckle up!'"
– Cheddar Flow [1]
Mistakes to Avoid When Reading VIX Charts
Misinterpreting the spot VIX and futures prices is a common pitfall. Remember, VIX futures and options represent forward-looking expectations tied to their specific expiration dates, not the spot VIX level [1][13][16]. Confusing these can lead to errors in assessing roll yield and risk [1][13][15][16].
Another frequent mistake is backtesting strategies on the VIX index instead of futures. Many traders discover seemingly “exceptional” returns during backtesting, only to realize these results aren’t achievable in real trading since the VIX index itself isn’t directly tradable [15]. Lastly, while a high VIX often aligns with falling stock prices, it’s crucial to understand that the VIX measures the expected range of movement, reflecting market sentiment rather than providing a definitive directional forecast [13][14].
Using TraderVPS for VIX Analysis on NinjaTrader
When it comes to analyzing VIX futures curves, having the right infrastructure is crucial. Volatility can shift in an instant, and tools like TraderVPS ensure NinjaTrader is equipped to handle these rapid changes. For example, when the curve transitions from contango to backwardation, even a few seconds of delay can mean missing out on a profitable trade. With this integration, you get the speed and reliability needed to act on the strategic insights discussed earlier.
How TraderVPS Enhances NinjaTrader's Performance
VIX spikes are notoriously short-lived, often reverting to the mean within hours or days. TraderVPS tackles this challenge with an ultra-low latency of just 0.52 milliseconds to the CME exchange in Chicago. This is achieved through direct fiber-optic cross-connects, bypassing the usual network delays that can plague home internet connections. The result? NinjaTrader can execute trades faster, giving you an edge in the fleeting windows of volatility [17][18][19].
Another critical feature is the 99.999% uptime guarantee, which is essential for VIX futures trading since the market operates nearly 24 hours a day. Global news can spark sudden shifts in the curve at any time, making uninterrupted monitoring a must - even when you're away. TraderVPS ensures your automated strategies remain active and reliable around the clock [19].
Key Features of TraderVPS for VIX Analysis
For traders focused on decoding VIX curves, speed and efficiency are non-negotiable. TraderVPS delivers on this with NVMe M.2 SSD storage, which provides lightning-fast access to historical VIX data. This is invaluable for backtesting curve patterns or analyzing years of futures price movements [19]. Additionally, AMD EPYC processors power through complex volatility models, such as exponential moving averages and polynomial fits, helping to filter out false signals effectively [12][19].
The platform also supports multi-monitor setups via Remote Desktop Protocol, allowing you to maintain a professional trading environment. You can dedicate separate screens to term structure charts, historical analysis, and real-time order execution. TraderVPS servers come pre-configured with Windows Server 2022 and support major futures data feeds like Rithmic, CQG, dxFeed, and IQFeed, ensuring accurate VIX curve plotting within NinjaTrader [19].
Why TraderVPS Is Essential for Futures Trading
With network speeds exceeding 1Gbps and the ability to burst up to 10Gbps, TraderVPS is built to handle the demands of institutional-grade trading. Its Chicago-based data center placement minimizes slippage and ensures smooth data throughput, even during high-volume trading sessions. For automated strategies that monitor roll yield in contango or track how contracts "slide up the curve" in backwardation, this always-on infrastructure is a game-changer [1][4][19].
As of December 16, 2025, TraderVPS servers have processed $16.44 billion in daily futures volume, proving their ability to handle intense trading demands. For traders aiming to capitalize on the subtle yet time-sensitive signals in VIX futures curves, this level of performance is indispensable [19].
Trading Strategies Using VIX Curve Trends
Using insights from VIX curve trends and historical behaviors, traders can develop strategies to take advantage of these patterns. Whether you're targeting short-term gains or aiming to mitigate long-term portfolio risks, understanding how the curve behaves is key to effective execution.
Short-Term VIX Trading Strategies
One common approach is roll yield harvesting, which applies during contango conditions. In this scenario, near-term VIX futures are priced lower than longer-dated contracts. By shorting these futures, traders can profit as their prices converge downward toward the spot VIX at expiration [1][4]. Conversely, in backwardation, taking long positions can be profitable as futures prices rise to meet the spot VIX [4].
However, relying solely on basic slope signals can be risky. For instance, in October 2014, the VIX futures curve briefly shifted into backwardation but returned to contango by October 22. During this period, the S&P 500 dropped only 2%, creating a false alarm that might have caused traders to exit equity positions prematurely [12]. To avoid such noise, a one-month Exponential Moving Average (EMA) can help identify genuine turning points. Research shows that EMA-based strategies achieved a Sharpe ratio of 0.54, outperforming the 0.30 ratio of a simple buy-and-hold approach [12].
Another effective technique is curvature analysis, which involves measuring the second-order coefficient through polynomial fitting. This method can signal market inflection points before the slope of the curve turns negative [12]. Compared to simpler slope strategies, curvature analysis delivered a Sharpe ratio of 0.56 with fewer trades - an average of just 2.96 per year versus 8.80 [12].
While these short-term strategies focus on quick shifts in the curve, long-term approaches use sustained curve inversions to manage portfolio risks.
Long-Term Risk Management with VIX Curves
Since February 24, 2006, the VIX futures curve has been in backwardation just 18.8% of the time, typically during major crises like 2008 or 2020 [2]. When the curve inverts, it acts as a warning signal for long-term investors to adopt defensive measures. This might include reducing exposure to vulnerable assets, holding more cash, or using VIX futures as a hedge [1].
"An inverted VIX futures curve is essentially the market screaming 'danger ahead – buckle up!'. For traders and investors, it's a cue to adopt a more defensive stance." - Cheddar Flow [1]
A historical example occurred during the March 2018 tariff shock. After the U.S. announced steel and aluminum tariffs, the VIX surged to 24.87 on March 22, and the curve sharply inverted as traders sought immediate protection. Recognizing this inversion as a signal of "peak fear", some investors hedged their portfolios or reduced equity risk. As negotiations began, the curve gradually reverted to contango [1]. A strategy that alternates between the S&P 500 and Treasuries based on the VIX futures slope can nearly double a portfolio's Sharpe ratio from 0.30 to 0.56 [12].
Algorithmic Trading with VIX Data
Algorithmic models take these strategies further by automating trade execution and refining signals. For example, algorithms can use EMA smoothing with a 10-day or one-month half-life to filter out minor fluctuations and avoid unnecessary trades [12]. More advanced models incorporate polynomial fitting to capture the curve's nonlinearity, combining this with macroeconomic indicators like Treasury yield spreads (10-year vs. 3-month) for better predictive accuracy [12].
The VIX is known for its mean-reverting nature. Contango is the typical state, as traders generally expect the index to return to its long-term average of around 20 when spot levels are low [3][4]. Algorithmic triggers can be set based on running averages plus one or two standard deviations to identify statistically significant inflection points [12].
| Strategy Type | Annual Return | Sharpe Ratio | Annual Turnover |
|---|---|---|---|
| Buy and Hold (S&P 500) | 7.74% | 0.30 | 0 |
| 7-4 Month Simple Slope | 5.33% | 0.27 | 8.80 |
| Exponential Moving Average | 10.27% | 0.54 | 0.48 |
| Polynomial Fitting (X²) | 10.77% | 0.56 | 2.96 |
Data based on VIX futures from March 2004 to September 2016 [12]
Conclusion
Summary of Key Concepts
VIX futures curves provide a window into market sentiment and potential turning points. When the curve is in contango, it reflects normal market conditions. On the other hand, backwardation suggests heightened demand for immediate hedging, often during periods of market stress. Historical data underscores this: for instance, during the pandemic peak on March 18, 2020, backwardation persisted for 101 days with a steep -35.55 spread. Similarly, the 2008 financial crisis saw backwardation lasting 161 days with a -21.19 spread. These patterns often precede sharp equity declines, signaling traders to adopt defensive strategies, such as hedging or algorithmic adjustments. Notably, strategies using tools like exponential moving averages (EMA) or polynomial fitting to reduce market noise have achieved Sharpe ratios exceeding 0.54 - nearly double the 0.30 benchmark of a standard buy-and-hold approach[12].
Effectively applying these insights demands a dependable trading platform.
Using TraderVPS for Better VIX Analysis
Analyzing VIX futures requires constant vigilance and the ability to act quickly on signals. TraderVPS offers the tools to meet these demands with ultra-low latency, consistent uptime, and strong security. Whether you're running a straightforward EMA-based strategy or a more complex polynomial model to analyze curve behavior, TraderVPS ensures minimal downtime and fast trade execution. This reliability is key for taking advantage of fleeting opportunities in the VIX futures market.
Getting Started with VIX Curve Analysis
Ready to put these concepts into action? Here’s a streamlined approach to start analyzing VIX futures curves effectively.
Begin by using live VIX futures data from the Cboe. Platforms like NinjaTrader can help you chart contracts from the front month out to six or seven months. Apply a one-month EMA to smooth out noise and reduce false signals, which helps avoid unnecessary trades[12]. Set alerts for critical curve inversions or extreme spreads - such as the -4.95 level observed on August 15, 2025[6] - to identify shifts that may require defensive portfolio adjustments. Finally, deploy your strategy on TraderVPS to benefit from minimal latency and reliable automation, ensuring you can act on opportunities promptly while managing risk effectively.
FAQs
What’s the difference between contango and backwardation in VIX futures curves?
The terms contango and backwardation describe two distinct patterns of the VIX futures curve, which highlight how the market views future volatility.
When the curve is in contango, it slopes upward. This means that longer-term VIX futures are priced higher than contracts closer to expiration. Contango tends to occur in calmer market conditions, where traders expect volatility to increase gradually over time. It's the more typical shape of the curve.
On the other hand, backwardation presents a downward-sloping curve, with near-term futures priced higher than those further out. This shape appears during periods of intense market stress or sudden spikes in volatility, as traders expect current turbulence to subside over time. Backwardation is less frequent and often signals heightened uncertainty in the market.
How do traders use VIX futures curves to analyze market volatility?
Traders rely on the VIX futures curve - a line connecting the prices of VIX contracts across various expiration dates - to gauge how the market views future volatility. When the curve slopes upward, known as contango, it indicates that near-term volatility is expected to remain low, with a steady rise anticipated over time. On the other hand, a downward slope (backwardation) suggests elevated short-term risk, often hinting at possible market instability.
The VIX, often referred to as the "fear gauge", measures market sentiment by analyzing S&P 500 option prices. Historically, backwardation has been a rare phenomenon, typically appearing during times of severe market stress, like the 2008 financial crisis or the turbulence in March 2020. Traders closely watch for changes in the shape of the curve, using these shifts to refine strategies, hedge their portfolios, or manage risks more effectively.
How does TraderVPS help optimize VIX futures trading strategies?
TraderVPS provides the fast and dependable infrastructure that’s crucial for executing VIX futures strategies effectively. In VIX futures trading, timing is everything. The shifts between contango and backwardation can have a major impact on profitability. A VPS helps by ensuring your orders are executed instantly, cutting down on delays and slippage, especially during periods of market volatility.
Trading VIX futures often demands 24/5 availability and relies heavily on automated scripts to monitor the term structure, manage risk, and calculate volatility premiums. With TraderVPS, you get a stable, always-online server environment equipped with the programming support and bandwidth needed to process real-time market data and handle high trading volumes without a hitch.
The complexity of VIX futures - such as cash-settlement and analyzing the term structure - also calls for advanced quantitative models. Hosting these models on TraderVPS allows you to focus on fine-tuning your strategies, knowing the platform will deliver accurate and uninterrupted execution when market conditions change.


