
10 Highest Volatility Forex Pairs for 2026 Trading
Forex trading in 2026 is set to be shaped by high-volatility currency pairs, offering both opportunities and risks. High volatility means larger price swings, which can lead to greater profit potential - but also demands careful risk management. Here's a quick overview of the top 10 pairs to watch:
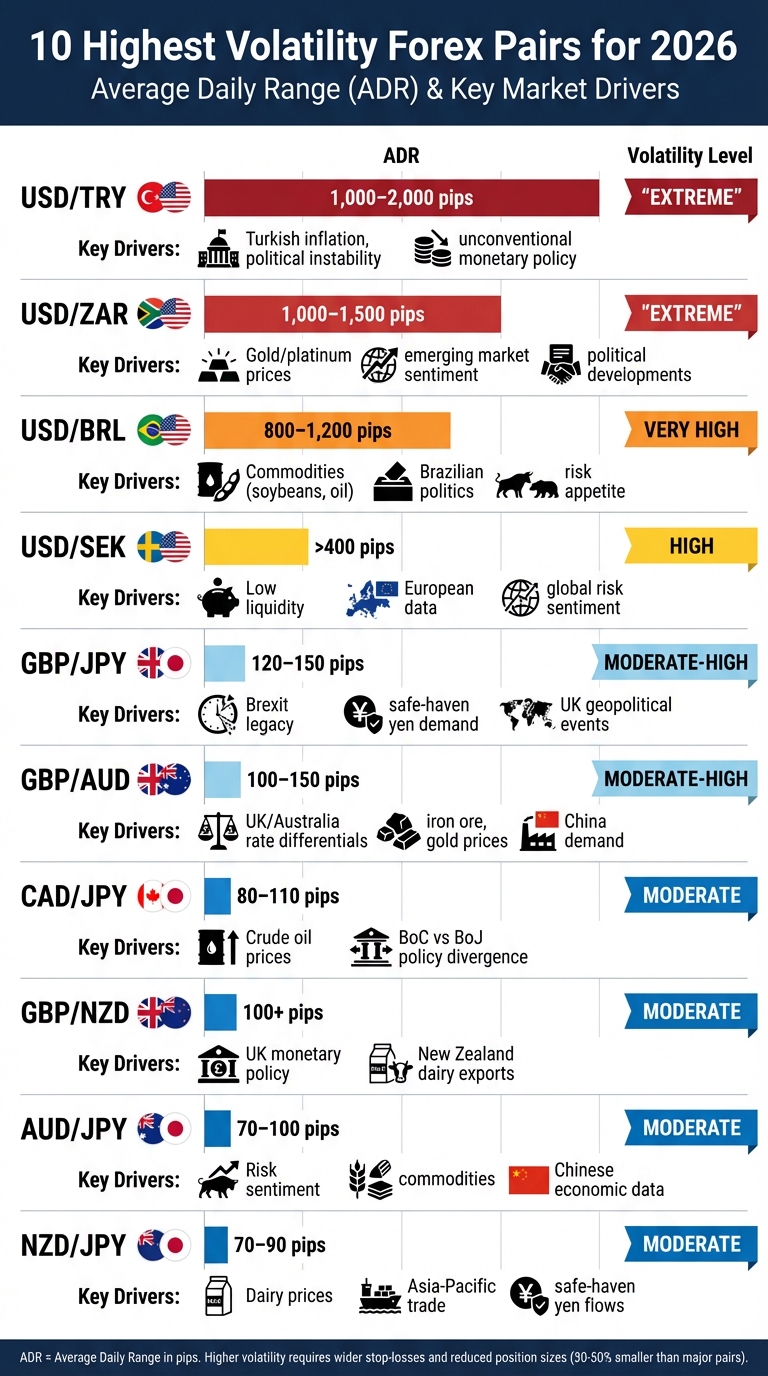
- USD/TRY: Extreme daily moves (1,000–2,000 pips) driven by Turkey's political and economic instability.
- USD/BRL: Highly reactive to Brazil's political shifts and commodity prices, with daily ranges of 800–1,200 pips.
- USD/SEK: Low liquidity amplifies its volatility, with daily moves exceeding 400 pips.
- GBP/AUD: Influenced by UK-Australia rate differentials and Chinese demand for Australian resources (100–150 pips daily).
- AUD/JPY: A risk sentiment indicator, moving 70–100 pips daily, tied to commodities and Chinese data.
- GBP/NZD: Averages 100+ pips daily, driven by UK monetary policy and New Zealand's dairy export trends.
- CAD/JPY: Oil prices and central bank policies influence its 80–110 pip daily range.
- USD/ZAR: Commodity prices and South African politics drive its massive 1,000–1,500 pip daily moves.
- GBP/JPY: Known as "The Dragon", this pair swings 120–150 pips daily, impacted by global risk sentiment.
- NZD/JPY: Moves 70–90 pips daily, shaped by New Zealand's export data and Asia-Pacific trade dynamics.
Quick Comparison Table
| Currency Pair | Projected ADR (2026) | Key Drivers |
|---|---|---|
| USD/TRY | 1,000–2,000 pips | Turkish inflation, political instability |
| USD/BRL | 800–1,200 pips | Commodities, Brazilian politics |
| USD/SEK | >400 pips | Low liquidity, global sentiment |
| GBP/AUD | 100–150 pips | UK-Australia rates, China demand |
| AUD/JPY | 70–100 pips | Risk sentiment, commodities |
| GBP/NZD | 100+ pips | Dairy exports, UK policies |
| CAD/JPY | 80–110 pips | Oil prices, central banks |
| USD/ZAR | 1,000–1,500 pips | Gold/platinum, South African politics |
| GBP/JPY | 120–150 pips | Risk sentiment, global events |
| NZD/JPY | 70–90 pips | Dairy prices, trade dynamics |
These pairs demand wider stop-loss levels, smaller positions, and close attention to economic and political events. Focus on trading during high-liquidity sessions, and always monitor key drivers like interest rates, commodity prices, and geopolitical developments.
Top 10 Most Volatile Forex Pairs 2026: Daily Range & Key Drivers Comparison
10 most volatile forex pairs to trade
1. USD/TRY
USD/TRY stands out as one of the most unpredictable currency pairs, showcasing both the challenges and opportunities that come with navigating the high-volatility environment of 2026.
Average Daily Range (ADR)
On a typical day, USD/TRY moves about 80–100 pips. However, during periods of heightened volatility, those movements can soar past 400 pips, even reaching an astonishing 1,000–2,000 pips in extreme cases [4][10][11]. Such dramatic price swings require traders to implement stricter risk management strategies and adjust to smaller position sizes compared to trading more stable currency pairs [4].
Key Economic and Geopolitical Drivers
The Turkish Lira's volatility stems from a mix of economic and political factors. Turkey's Central Bank is expected to reduce its policy rate from 38.5% at the close of 2025 to around 27% by the end of 2026 [12]. Meanwhile, inflation is projected to stay at approximately 22%, significantly surpassing the official target of 16% [12].
"The lira will likely remain volatile until the current political instability in Turkey is settled." – Chris Beauchamp, Chief Market Analyst, IG [9]
Political uncertainty has been a persistent issue for the Lira since 2016, with domestic turbulence and sudden policy changes fueling erratic price movements [9]. As an exotic currency pair, USD/TRY has lower liquidity than major pairs, meaning even relatively small trades can lead to sharp price fluctuations [6][10].
These economic and political factors shape the unique trading conditions that define USD/TRY in 2026.
Relevance for 2026 Trading Opportunities
Projections for 2026 suggest a steady upward trajectory for USD/TRY, with the pair expected to climb from 46.15 in Q1 to 52.00 by Q4 [12]. Traders should pay close attention to Central Bank announcements and key economic indicators, especially inflation data, as these often trigger significant volatility [12]. The pair is most active during the overlap between the London and New York trading sessions (12:00–16:00 GMT) [10][11].
To navigate USD/TRY's rapid fluctuations, traders should consider wider stop-loss levels and account for broader spreads [10][15]. Given the pair's high volatility and the limited reliability of technical patterns, a strategy rooted in fundamental analysis - focusing on Turkish monetary policy and political developments - can often yield better results than relying solely on chart-based approaches [9][14].
2. USD/BRL
The Brazilian Real is one of the most unpredictable emerging market currencies, heavily influenced by commodity prices, political developments, and global risk sentiment.
Average Daily Range (ADR)
USD/BRL typically fluctuates between 800 and 1,200 pips each day - far surpassing the daily movements seen in major currency pairs [4] [17]. This heightened activity is most pronounced during the New York trading session (8:00 a.m. to 5:00 p.m. EST), when both U.S. and Brazilian economic announcements inject additional liquidity into the market [3]. These significant daily price swings create an environment where economic and political events can rapidly reshape the landscape.
Key Economic and Geopolitical Drivers
Several factors amplify the pair's volatility. Brazil's upcoming presidential election in October 2026 is expected to be a major market-moving event. The race will likely pit current president Luiz Inácio Lula da Silva against right-wing challengers, potentially including figures such as members of the Bolsonaro family or São Paulo Governor Tarcísio de Freitas [16]. The campaign is anticipated to deepen political divisions, with polling data likely to provoke sharp market reactions.
As the largest economy in Latin America and a key exporter of agricultural and mineral resources, Brazil’s currency is highly sensitive to global prices for commodities like soybeans, iron ore, and oil [4] [5] [13]. Additionally, the Central Bank of Brazil frequently steps in to stabilize the currency during periods of extreme volatility, which can lead to sudden reversals in price trends. The pair also acts as a "risk-on/risk-off" indicator, with the Real weakening significantly when global uncertainty drives investors toward the safety of the U.S. dollar [4] [17].
Historical Volatility Patterns
Major political events have historically caused sharp declines in the Brazilian Real [9]. For example, the U.S. dollar saw a 10% decline starting in 2025, driven by concerns over fiscal policy and Federal Reserve decisions [7]. Institutional interest in the Real has also grown, with CME Group reporting a 109% rise in BRL futures trading volumes between 2022 and 2025 [8].
Relevance for 2026 Trading Opportunities
Traders should keep a close eye on Brazilian polling data, as political developments can spark significant intraday price swings [16]. Additionally, monitoring commodity indices - particularly those for iron ore and soybeans - can provide early indications of potential BRL movements [5] [13]. Given the pair's high ADR, using wider stop-loss levels is crucial. Successfully navigating USD/BRL's dynamic shifts requires a combination of strong fundamental analysis and disciplined risk management strategies.
3. USD/SEK
The USD/SEK currency pair presents a mix of challenges and opportunities, largely due to the Swedish Krona's low liquidity. This characteristic contributes to the pair's volatility, creating notable intraday swings, though not as extreme as those seen with USD/TRY or USD/BRL. These wide daily price movements make USD/SEK a compelling option for traders seeking dynamic market conditions.
Average Daily Range (ADR)
The Average Daily Range (ADR) for USD/SEK highlights its unique behavior in the forex market. On average, this pair moves over 400 points daily, a stark contrast to the roughly 100-point average for GBP/USD. This heightened activity is primarily driven by limited liquidity, which amplifies the impact of even small orders, especially during major U.S. economic announcements [10].
Key Economic and Geopolitical Drivers
Looking ahead to 2026, the Federal Reserve's easing cycle is expected to play a pivotal role in shaping USD/SEK volatility. By the end of the year, interest rates are projected to settle between 3.25% and 3.50% [19]. The U.S. Dollar Index, which started 2026 near 98 after a 10% drop in 2025 [7][19], reflects shifting market dynamics. USD/SEK often mirrors broader risk sentiment, weakening when demand for the safe-haven dollar declines. Notably, asset managers increased FX hedging by 32% in late 2025, signaling heightened market caution [8].
Historical Volatility Patterns
In April 2025, daily global FX transactions hit a record $9.51 trillion, spurred by changes in U.S. tariff policies [8]. This surge left a lasting impression on market sentiment. For USD/SEK, its low liquidity makes the pair particularly vulnerable to sudden price spikes and unreliable technical signals [10].
Relevance for 2026 Trading Opportunities
Traders can anticipate two-way volatility for USD/SEK in 2026, with a general downward bias for the dollar [19]. However, short-term dollar rebounds may occur in the first half of the year if inflation proves persistent. Given the pair's 400+ point ADR, it's advisable to reduce position sizes by 30–50% compared to major pairs [4][6]. Additionally, using wider stop-loss orders, such as those based on ATR (Average True Range), can help manage sudden price swings. For optimal execution and tighter spreads, focus on trading during the London–New York session overlap [6][11].
4. GBP/AUD
The GBP/AUD currency pair brings together economic influences from two contrasting regions: the UK and Australia. The British pound is primarily shaped by factors like the UK's service sector performance, inflation trends, and decisions by the Bank of England. Meanwhile, the Australian dollar is often referred to as a commodity currency, as its value is closely tied to global risk sentiment and demand for Australian resources, particularly from China [6][3]. These differences create unique trading opportunities with frequent and significant price swings.
Average Daily Range (ADR)
When it comes to daily movement, GBP/AUD is known for its volatility, typically covering more than 100 pips per day [10]. This range falls between the 50-70 pips seen in EUR/GBP and the 120-150 pips of GBP/JPY [11][3]. The pair hit a multi-year high above 2.00 in August 2024, showcasing its potential for dramatic directional moves [20]. Trading activity for GBP/AUD is most active during the London-Sydney session overlap (8:00 AM to 5:00 PM GMT), when both markets are open and liquidity is at its peak [3].
Key Economic and Geopolitical Drivers
The pair's behavior in 2026 is expected to be influenced by monetary policy divergence between the Bank of England (BoE) and the Reserve Bank of Australia (RBA). The BoE is projected to lower interest rates to around 4.2% by Q3 2025, down from 5% in late 2024, signaling potential adjustments into 2026 [20]. On the other hand, the Australian dollar's strength will continue to depend heavily on commodity prices and industrial data from China, Australia’s largest export market [6][20].
Historical Volatility Patterns
Despite historical ties between the UK and Australia, their currencies have diverged significantly in recent years. Events like Brexit and trade tensions have driven this decoupling [6][9]. For instance, GBP/AUD spiked to 2.08 during the March 2020 pandemic as the Australian dollar weakened sharply, only to drop to 1.59 following the UK's September 2022 mini-budget crisis [20]. Long-term forecasts suggest the pair may climb to 2.152 by 2027, reflecting ongoing upward pressure [20].
Relevance for 2026 Trading Opportunities
With its high daily range and sharp price movements, GBP/AUD offers plenty of trading opportunities. Keeping a close eye on Chinese industrial data is crucial, as it often provides early clues about AUD trends due to Australia's reliance on exports to China [6][20]. Given the pair’s typical ADR of over 100 pips, traders should use volatility-adjusted stop-loss orders to avoid being prematurely stopped out by normal intraday fluctuations [11][10]. The best time to trade GBP/AUD is during the London-Sydney session overlap, where liquidity is highest and spreads are tighter [3]. Additionally, the pair acts as a "risk-off" indicator, with the Australian dollar weakening during periods of global uncertainty while the British pound remains relatively stable, leading to sharp upward moves in GBP/AUD [3].
5. AUD/JPY
AUD/JPY serves as a classic indicator of market sentiment, blending the commodity-driven Australian dollar with the safe-haven Japanese yen. This pairing often experiences significant swings as traders alternate between risk-taking and risk-averse behaviors [3][24]. When markets are optimistic and commodity demand is strong, the Australian dollar tends to strengthen. Conversely, during periods of global uncertainty, the yen typically gains as investors seek stability [3][24].
Average Daily Range (ADR)
The average daily movement for AUD/JPY ranges between 70 and 100 pips [4][21]. While not as volatile as exotic pairs like USD/ZAR (1,000–1,500 pips) or USD/TRY (1,000–2,000 pips), it still provides plenty of trading opportunities without the heightened risks associated with emerging market currencies [4][21]. Volatility is most pronounced during the Asian trading session, particularly during the overlap between the Tokyo and Sydney markets (10:00 AM to 2:00 PM AEDT). During this time, announcements from the Reserve Bank of Australia (RBA) and key Chinese economic data often drive significant price action [4][9][23].
Key Economic and Geopolitical Drivers
In 2026, AUD/JPY's movements are expected to hinge on several factors. The RBA’s potential interest rate hikes, spurred by domestic inflation concerns, and the Bank of Japan's (BoJ) gradual departure from its ultra-loose monetary policies will be key influences [23]. Additionally, the pair is highly sensitive to fluctuations in commodity prices - particularly iron ore, coal, and gold - as well as China's economic performance. Chinese data releases frequently act as a catalyst for sharp price movements [21][3][22]. These drivers underscore the pair's dynamic nature and its responsiveness to both economic and geopolitical developments.
Historical Volatility Patterns
AUD/JPY has earned a reputation for its volatility, especially evident in 2023 when dramatic shifts occurred as traders alternated between growth-focused and defensive strategies [1][25]. Unlike relatively stable pairs like EUR/USD, AUD/JPY’s contrasting economic fundamentals often result in sudden, large price swings during major geopolitical or economic events [18]. While its volatility is moderate compared to exotic pairs, it still stands out for its unique risk-on/risk-off behavior.
Relevance for 2026 Trading Opportunities
For traders eyeing AUD/JPY in 2026, keeping an eye on BoJ policy announcements will be crucial, as these can spark rapid moves of 300–400 pips within minutes [23]. Given the pair's typical daily range, wider stop-loss orders may be necessary compared to those used for major currency pairs. Additionally, Chinese economic data releases will offer early clues about shifts in global risk sentiment, making them vital for informed trading decisions [4].
6. GBP/NZD
The GBP/NZD currency pair offers a direct trading route between the British pound and the New Zealand dollar, bypassing the need for USD conversion. This setup helps cut transaction costs but introduces a distinct layer of regional volatility [26]. The pair reflects a unique interaction: the British pound, a major reserve currency, is shaped by post-Brexit economic developments and Bank of England policies, while the New Zealand dollar is heavily tied to commodity markets, particularly agricultural exports, and the economic health of China [26][1].
Average Daily Range (ADR)
GBP/NZD sees an average daily movement of 147 pips - a slight increase from 136 pips in 2024 but still below its 2015 high of 279 pips. Over the long term, the pair has averaged 201 pips daily between 2014 and 2025 [27]. Compared to major pairs like EUR/USD, which averages around 80 pips, GBP/NZD is considerably more volatile. However, it’s still less extreme than exotic pairs like USD/ZAR or USD/TRY, which can move between 1,000 and 2,000 pips daily [4][18]. The pair is most active during the overlap of the London trading session (8:00 AM–4:00 PM UK time) and the Wellington session (10:00 PM–6:00 AM UK time) [26]. These numbers highlight the pair’s potential for significant price action, driven by underlying economic factors.
Key Economic and Geopolitical Drivers
In 2026, the volatility of GBP/NZD is largely shaped by two key factors: the Bank of England’s post-Brexit policy maneuvers and the Reserve Bank of New Zealand’s response to global commodity markets and Chinese economic trends [26][1]. The New Zealand dollar is particularly sensitive to fluctuations in commodity prices, especially for dairy, meat, and wood exports [26][9]. Given New Zealand’s strong trade ties with China, any slowdown in Chinese economic growth has a direct impact on the NZD. On the other side, the pound continues to react to post-Brexit economic indicators, such as GDP growth and employment data, which play a major role in determining its strength and, by extension, the pair’s volatility [26].
Historical Volatility Patterns
Looking back, GBP/NZD has seen notable shifts in volatility. During the mid-2010s, the pair experienced extreme daily movements, averaging 246 to 279 pips in 2015–2016. Since then, volatility has moderated, with daily ranges settling between 136 and 162 pips from 2023 to 2025 [27]. This reduction reflects a more stable global economic backdrop compared to the Brexit era. Despite this moderation, GBP/NZD remains one of the most active cross-currency pairs, offering traders significant price swings without venturing into the riskier territory of emerging market currencies [27].
Relevance for 2026 Trading Opportunities
For traders in 2026, GBP/NZD offers both opportunities and challenges. Its high daily volatility demands careful risk management. Reducing position sizes by 30–50% compared to major pairs like EUR/USD can help manage the heightened risk [4]. Wider stop-loss levels are crucial to account for the pair’s natural price swings and avoid being prematurely stopped out [4]. Keeping an eye on New Zealand’s dairy auction results and agricultural export data can provide early indications of NZD movement. Similarly, monitoring Bank of England policy updates is key to gauging shifts in Sterling strength [26][9]. Timing trades during the overlap of the UK and Asian/Pacific sessions can maximize liquidity and take advantage of the pair’s most active periods [4].
7. CAD/JPY
The CAD/JPY currency pair stands out for its contrasting characteristics. On one side, you have the Canadian dollar, which is heavily influenced by commodity prices and thrives in "risk-on" market environments. On the other, there's the Japanese yen, known as a safe-haven currency that investors flock to during turbulent times [6][9]. This mix creates a dynamic and often volatile pairing, with 2026 shaping up to be no exception. The pair sees its most significant activity during the North American session when Canadian markets are open, although notable price movements can also occur during Tokyo trading hours [4]. This interplay between commodities and safe-haven dynamics makes CAD/JPY a fascinating pair to watch.
Average Daily Range (ADR)
In 2026, CAD/JPY typically moves between 80 and 110 pips daily, with recent data showing an average of about 90 pips or a 0.82% daily move [4][18][28]. While this range is broader than that of more stable pairs like EUR/USD, it is still less extreme than exotic pairs such as USD/TRY or USD/BRL, which can see daily swings exceeding 400 pips [10]. Volatility tends to peak during the Tokyo–London overlap (6:00 PM–7:00 PM AEDT) and continues into the North American trading hours, offering traders multiple opportunities to capitalize on price movements [23].
Key Economic and Geopolitical Drivers
The volatility of CAD/JPY is closely tied to oil prices. Canada, being a major oil exporter, benefits from rising crude oil prices, which strengthen the Canadian dollar. Meanwhile, Japan, as a significant oil importer, sees its yen weaken under the pressure of higher energy costs [6][9]. This inverse relationship between the two currencies is a key driver of the pair's movements.
Adding to the mix in 2026 is the divergence in monetary policies. The Bank of Japan is gradually moving toward policy normalization, while the Bank of Canada is fine-tuning its interest rate strategy [18][23]. When central banks make unexpected announcements, yen-related pairs like CAD/JPY can see dramatic swings, sometimes reaching 300–400 pips during heightened volatility [23].
Historical Volatility Patterns
The CAD/JPY pair has a well-established reputation for volatility, stemming from its commodity-driven Canadian dollar and safe-haven yen. During times of economic uncertainty, the yen tends to strengthen as investors seek stability, while the Canadian dollar weakens amid declining commodity demand [4][28]. On the flip side, when oil prices rally or global risk sentiment improves, CAD/JPY often experiences sharp upward movements. Although overall market volatility has eased somewhat heading into 2026, commodity-linked pairs like CAD/JPY remain more active than traditional major pairs [8]. This heightened sensitivity to energy markets and risk sentiment ensures that the pair continues to see larger price swings compared to many other pairs [6][9].
Relevance for 2026 Trading Opportunities
Trading CAD/JPY in 2026 requires careful planning and strict risk management. With an average daily range of 80–110 pips, traders should use wider stop-loss levels to avoid being prematurely stopped out during routine price fluctuations [4]. To account for this volatility, it’s a good idea to reduce position sizes by 30–50% compared to trades involving less volatile pairs [4].
Keeping a close eye on oil market developments and OPEC+ announcements is essential, as these factors directly impact the pair's movements [1][4]. Timing is another critical factor - trading during the North American session offers the best liquidity and clearer price action. However, traders should avoid the "Dead Zone" (7:00 AM–9:00 AM AEDT) when liquidity dries up and spreads widen [4][23]. Tools like the Average True Range (ATR) and Bollinger Bands can help manage intraday swings effectively [18].
8. USD/ZAR
The USD/ZAR currency pair is known for its intense volatility, a characteristic tied to South Africa's emerging market status and reliance on commodity exports. The South African Rand is particularly influenced by fluctuations in gold and platinum prices, two of the country's key exports [3][5]. As Dukascopy Bank SA explains:
"USD/ZAR is characterized by exceptional volatility, reflecting South Africa's status as an emerging market economy and its sensitivity to global market dynamics" [4]
This volatility presents unique challenges for traders, especially as we look toward 2026.
Average Daily Range (ADR)
USD/ZAR typically experiences daily movements in the range of 1,000–1,500 pips, with an average daily change of about 3.0% [4][31]. To put this in perspective, while EUR/USD might see daily fluctuations of around 80 pips, USD/ZAR regularly surpasses 1,000 pips. Liquidity is highest during the overlap of the London and New York trading sessions (9:00 AM–4:00 PM GMT). However, during major news events, spreads - usually between 3 and 6 pips - can widen significantly, sometimes reaching up to 50 pips.
Key Economic and Geopolitical Drivers
USD/ZAR's volatility stems from a mix of commodity price shifts and local political developments. For instance, gold prices surged past $4,200 per ounce in late 2025, heavily influencing the Rand's value [30]. Additionally, monetary policy differences between the U.S. Federal Reserve and the South African Reserve Bank (SARB) have played a role. By late 2025, the SARB had reduced its repo rate to 7.00% from 8.25% [29]. Political events, such as the 2026 municipal elections, are expected to add further unpredictability [30][3].
On the positive side, South Africa's removal from the FATF "grey list" and record-high foreign exchange reserves of $71.55 billion in October 2025 have helped stabilize the economy [30]. As Finance Minister Enoch Godongwana noted:
"The path forward is straightforward: if revenue misses targets, government must either increase taxes or reduce spending" [30]
Historical Volatility Patterns
Over the past three years, the Rand's 30-day realized volatility averaged 12.9%, nearly double that of EUR/USD. During this period, the Rand lost over 20% against the U.S. Dollar, with its high-to-low range nearing 50% [32]. In September 2025, the Rand fell below the R17.50 support level following a 4% weekly spike in gold prices to $3,600 per ounce and dovish signals from the U.S. Federal Reserve [29]. By late 2025, USD/ZAR had established a bearish trend, breaking below the psychological R17.00 level and its 200-week simple moving average, signaling potential long-term downward momentum heading into 2026 [29][30].
These patterns highlight the importance of adopting risk management strategies tailored to this pair's unique behavior.
Relevance for 2026 Trading Opportunities
Trading USD/ZAR in 2026 will demand a cautious and calculated approach. Due to the pair's large swings, traders should adjust position sizes and use wider stop-loss levels [4][21]. Keeping an eye on gold and platinum prices can provide clues about the Rand's direction, while U.S. labor data releases often trigger immediate volatility [29][3]. The ideal trading window remains during the overlap of the London and New York sessions, but traders must be prepared for wider spreads during major news events [31][3]. Technical tools like Moving Averages and the ADX indicator can help identify trends and better navigate the pair's significant intraday movements [33].
9. GBP/JPY
GBP/JPY has earned its reputation as the most volatile major cross-currency pair, often referred to by traders as "The Dragon." This pair brings together the British pound - highly reactive to economic and political developments - and the Japanese yen, a well-known safe-haven currency [3][4]. The combination creates a pair that can swing wildly, especially during shifts in global risk sentiment. Analyst Tobi Amure sums it up well:
"The market doesn't break traders; volatility-mismatch does." [23]
Let’s take a closer look at its daily movement patterns, key drivers, historical trends, and strategies for navigating this pair in 2026.
Average Daily Range (ADR)
When it comes to daily movement, GBP/JPY typically fluctuates between 120–150 pips under normal conditions [11]. However, during major news events or periods of heightened activity, these movements can surge to 150–300 pips in a single day [11]. For comparison, EUR/USD averages about 80 pips [4]. The pair’s most active trading periods are during the London-New York overlap (12:00 PM–4:00 PM GMT) and the Sydney-Tokyo overlap (11:00 PM–2:00 AM GMT) [11]. On the other hand, the "Dead Zone" between the New York close and Sydney open sees widened spreads and reduced liquidity, making it less favorable for trading [23].
Key Economic and Geopolitical Drivers
In 2026, monetary policy divergence between the Bank of England (BoE) and the Bank of Japan (BoJ) is expected to drive GBP/JPY volatility. While other central banks may ease rates, the BoJ's potential move toward policy normalization could trigger sharp price swings. A single rate hike announcement from the BoJ could cause the pair to move 300–400 pips in a short timeframe [23].
Additionally, GBP/JPY acts as a "risk-on/risk-off" indicator: it tends to rise when global equity markets are bullish and falls sharply during market downturns as investors flock to the yen [3]. Other factors, such as UK inflation, GDP data, and ongoing post-Brexit adjustments, add to its unpredictability [3]. The unwinding of the long-standing carry trade - where traders sell yen to buy higher-yielding currencies like the pound - is also expected to cause sharp corrections in 2026 [23].
Historical Volatility Patterns
Historically, GBP/JPY has consistently ranked as the most volatile forex pair based on average daily pip movements [11]. Its behavior is heavily influenced by global risk sentiment, with the pound and yen often moving in opposite directions. This dynamic creates significant price swings, offering high-reward opportunities for traders [3]. The pair frequently spikes during the London-Tokyo overlap, which can lead to false breakouts and requires careful analysis [4]. Its volatility has made it a favorite among day traders, swing traders, and those leveraging interest rate differentials between the BoE and BoJ [3].
Relevance for 2026 Trading Opportunities
Trading GBP/JPY in 2026 demands a tailored approach to risk management. Due to its larger price swings, traders are advised to reduce position sizes by 30–50% compared to EUR/USD [4][21]. Stop-loss orders also need to be wider to avoid being triggered by normal market fluctuations. Strategies that work for less volatile pairs like EUR/USD are unlikely to succeed here. As Mitrade Analysis puts it:
"If you trade the Dragon, your stop losses must be wider, and your ego must be non-existent. It will hunt you if you're careless." [23]
Using the ATR (Average True Range) to confirm breakout momentum before entering a trade is crucial [11]. Focus your trading efforts during the London-Tokyo overlap for better liquidity, and closely monitor the Bank of Japan’s announcements. Even minor shifts in their typically dovish policies can have an outsized impact on the market [23][3]. By applying these strategies, traders can navigate GBP/JPY's unique challenges and capitalize on its volatility in 2026.
10. NZD/JPY
The NZD/JPY currency pair, often referred to as the "Kiwi Yen", combines the New Zealand dollar - a currency tied closely to commodities and global risk appetite - with the Japanese yen, a well-known safe-haven asset [4]. This pairing is highly sensitive to shifts in global market sentiment. When optimism about economic growth prevails, the New Zealand dollar tends to strengthen, but during uncertain times, traders often pivot to the yen [3]. The pair's movements are also shaped by New Zealand's key exports, including dairy, meat, and wood products [6].
Average Daily Range (ADR)
NZD/JPY typically demonstrates a daily movement of 70–90 pips under normal market conditions [11]. The pair is most active during the overlap of the Sydney and Tokyo trading sessions (11:00 PM–2:00 AM GMT), when liquidity is at its highest and trading opportunities are abundant [11].
Key Economic and Geopolitical Drivers
In 2026, one of the main factors influencing NZD/JPY will be the interest rate gap between the Reserve Bank of New Zealand (RBNZ) and the Bank of Japan (BoJ) [3]. Additionally, the results of Global Dairy Trade auctions and economic data from China will play a critical role. For example, fluctuations in dairy prices or a drop in Chinese demand can weaken the New Zealand dollar [9][3]. It's worth noting that NZD/USD has remained below its 200-day moving average since late September 2025, signaling a bearish trend [7].
Historical Volatility Patterns
Historically, NZD/JPY ranks as the 7th most volatile forex pair, with an average daily pip movement that places it in the "Moderate–High" volatility category [11]. This pair is a reliable indicator of Asia-Pacific risk sentiment, often strengthening during risk-on periods. Volatility tends to peak around key data releases from the US and New Zealand, typically at 12:00 PM and 9:00 PM GMT [4][10]. Furthermore, the recovery of New Zealand's tourism sector continues to influence the Kiwi's value, following disruptions caused by the pandemic [6].
Relevance for 2026 Trading Opportunities
Trading NZD/JPY in 2026 will require a keen focus on both technical and fundamental factors. The Asian and early European sessions are ideal for trading due to higher liquidity [4]. Keep an eye on the 200-day moving average as a trend indicator; the NZD has shown bearish reactions when retesting this level [7]. Given the pair's typical daily range of 70–90 pips, traders should set wider stop-loss orders to accommodate normal price fluctuations [4][34]. Pay close attention to agricultural data, especially dairy auction results, and monitor Chinese economic indicators for early signs of strength or weakness in the New Zealand dollar [9][3]. For those who can navigate its sensitivity to commodities and risk sentiment, NZD/JPY offers compelling trading opportunities.
Quick Comparison of Volatility Metrics
To help you match your trading preferences with the right currency pairs, here’s a detailed look at the 10 forex pairs expected to show the highest volatility in 2026. The table below outlines their projected average daily ranges (ADRs), key drivers, and the factors influencing their movements.
| Currency Pair | Projected ADR (2025-2026) | Main Volatility Drivers |
|---|---|---|
| USD/TRY | 1,000–2,000 pips | Unconventional monetary policy, high inflation, Turkish political instability |
| USD/BRL | 800–1,200 pips | Oil and soybean prices, Brazilian political landscape, risk appetite |
| USD/SEK | >400 pips | Low liquidity, European economic data, global risk sentiment |
| GBP/AUD | 100–150 pips | UK/Australia interest rate differentials, iron ore and gold prices |
| AUD/JPY | 70–100 pips | Global risk-on/off sentiment, Chinese economic data, iron ore prices |
| GBP/NZD | 100+ pips | UK monetary policy, New Zealand dairy export valuations |
| CAD/JPY | 80–110 pips | Crude oil prices, Bank of Canada vs. Bank of Japan policy |
| USD/ZAR | 1,000–1,500 pips | Gold/platinum prices, emerging market sentiment, local political developments |
| GBP/JPY | ~150 pips | UK geopolitical events (Brexit legacy), safe-haven Yen demand |
| NZD/JPY | 70–100 pips | Dairy commodity prices, Asia-Pacific trade dynamics, safe-haven Yen |
The contrast between exotic pairs and major crosses is striking. Exotic pairs like USD/TRY can see daily moves exceeding 1,000 pips, far surpassing the relatively steady ~80-pip range typical of major currency pairs. This makes exotic pairs highly attractive for traders seeking big opportunities, but they also demand a cautious approach with wider stop-losses and robust risk management.
On the other hand, commodity-linked pairs, such as AUD/JPY and CAD/JPY, tend to stay within the 70–110 pip range. While their volatility is lower, they offer a level of predictability that exotic pairs lack. For example, USD/ZAR, backed by South Africa’s 12.9% average 30-day volatility [32], remains one of the most consistently volatile pairs, driven by factors like gold and platinum prices.
Looking ahead, monetary policy shifts are expected to amplify volatility in 2026. For instance, the Bank of Japan increased interest rates to 0.75% on December 19, 2025 - the highest since 1995 [35]. Meanwhile, the Federal Reserve continues easing. This divergence is likely to push JPY crosses, such as GBP/JPY and CAD/JPY, toward the upper limits of their projected ranges, creating fresh opportunities for traders.
How to Trade High-Volatility Pairs in 2026
Trading high-volatility currency pairs in 2026 demands a refined approach, different from more stable major pairs. One of the first steps is leveraging the Average Daily Range (ADR) to set realistic stop-loss levels. For example, if GBP/JPY averages a 140-pip daily movement [34], a 10-pip stop-loss is far too tight and almost guarantees you'll be stopped out prematurely. Instead, aim for stops that are 1.5× to 2× the ADR. For a pair with an 80-pip ADR, this means setting stops in the range of 120–160 pips. This approach allows you to protect your capital while giving trades enough breathing room to account for natural market fluctuations.
Adjusting your stop-loss strategy is just one part of the equation. Position sizing is equally critical when dealing with volatile pairs. Consider pairs like USD/TRY, which can swing by 1,000–2,000 pips in a single day, or USD/ZAR, which typically moves 1,000–1,500 pips [4]. To manage risk effectively, reduce your contract sizes by 30%–50% compared to more stable pairs like EUR/USD. Moreover, stick to the golden rule of risk management: never risk more than 1%–2% of your account balance on a single trade. Pair this with a 2:1 reward-to-risk ratio to ensure that the potential profit justifies the wider stops required [4][34].
Timing your entries is another essential factor. Major events like the FOMC Rate Decision can cause price swings of 200–400 pips, while Non-Farm Payrolls often lead to 150–300 pips of volatility [34]. For pairs such as GBP/USD, the London–New York trading overlap (8:00 AM–12:00 PM EST) typically offers the best liquidity and sharper price movements. On the other hand, JPY crosses like AUD/JPY and NZD/JPY are most active during the Sydney–Tokyo overlap (6:00 PM–9:00 PM EST) [11].
Fast execution is key when navigating volatile markets. During rapid price swings, slippage - where your order fills at a different price than expected - can become a costly issue [6][11]. Tools like TraderVPS can help mitigate this. With ultra-low latency connections and 24/7 uptime, TraderVPS ensures your orders execute as close to your target price as possible. Their high-performance servers, powered by AMD EPYC processors and NVMe storage, are designed to handle intensive chart analysis and backtesting without lag, even during moments of extreme market activity.
Lastly, patience pays off in volatile markets. Instead of chasing sudden price moves, wait for clear technical setups at key support and resistance levels. False breakouts are common in these conditions, and entering without confirmation can lead to quick losses [4]. Use the 14-day ATR (Average True Range) to adapt your strategy. When ATR rises above its average, widen your stops and reduce your position size to align with the heightened volatility [18].
Conclusion
The 10 highest volatility forex pairs for 2026 present a wealth of profit opportunities, but they also demand a disciplined approach. With daily price movements ranging from 70 to over 1,000 pips, the potential for gains is immense. However, these swings also come with heightened risks - 62% of retail forex and CFD accounts experience losses[36].
Trading these pairs successfully requires a balance of preparation and discipline. Factors like shifts in monetary policy, fluctuations in commodity prices, and geopolitical events will heavily influence volatility in 2026[3][13][4]. As Admiral Markets aptly puts it:
"Uncertainty is a close companion to volatility"[2]
Staying informed is essential. Keep a close eye on economic calendars for key events, such as Non-Farm Payrolls and central bank announcements, and adjust your strategies accordingly.
Risk management should be non-negotiable. Consider lowering position sizes by 30–50% compared to less volatile pairs, and never risk more than 1%–2% of your account on a single trade[2][4]. Use reliable technical tools to set stop-loss levels effectively. As Dukascopy Bank SA cautions:
"Forex volatility is the golden ticket to potential profits... but they also come with heightened risk that demands careful strategy and iron-clad risk management"[4]
FAQs
What are the best strategies for managing risk when trading highly volatile forex pairs?
To handle the risks of trading highly volatile forex pairs, start by tailoring your position size to the pair’s volatility. A good metric to consider is its average daily range (ADR). Pair this with lower leverage to limit the potential for large losses, and always place stop-loss orders at key levels to shield your trades from extreme price fluctuations.
Keep a close eye on economic events and breaking news that could spike the pair’s volatility, as these often lead to abrupt market shifts. Regularly assess your trading strategy and avoid putting too much of your portfolio into a single currency pair. By staying disciplined and well-prepared, you can better manage the ups and downs of high-volatility trading.
How do geopolitical events influence the volatility of forex pairs like USD/TRY and USD/BRL?
Geopolitical events - think elections, regional conflicts, trade sanctions, or sudden policy shifts - can shake up the forex market in a big way. These events often fuel uncertainty, which tends to amplify price swings, especially in already volatile currency pairs like USD/TRY and USD/BRL.
Take an unexpected election result or a dramatic change in a trade agreement, for instance. These scenarios can trigger rapid currency fluctuations as traders scramble to assess the potential economic fallout. While this kind of volatility introduces risks, it also opens up opportunities for those ready to adapt. Staying on top of global news and fine-tuning trading strategies accordingly can make all the difference.
Why should you adjust stop-loss levels based on the Average Daily Range (ADR) when trading volatile forex pairs?
When trading volatile currency pairs, aligning your stop-loss levels with the Average Daily Range (ADR) can make a big difference. The ADR reflects the typical price movement of a pair within a day, and setting your stop-loss to account for this natural fluctuation can prevent you from being stopped out by normal market swings.
This method doesn’t just keep you in trades longer; it also ensures your stop-loss remains strategically placed to manage risk effectively. It’s a smart way to navigate the ups and downs of volatile forex markets while maintaining control over potential losses.


