
Understanding Momentum: Impact on Stock Performance
Momentum trading is a strategy where traders focus on stocks that are gaining or losing value, betting that these trends will continue. The core idea is simple: buy high, sell higher. Historical data shows that momentum strategies have delivered consistent returns over decades, with an average annual return of 8.3% between 1927 and 2013. Tools like RSI, MACD, and the Momentum Oscillator help identify trends and reversals, making momentum a data-driven approach to trading.
Key Takeaways:
- Momentum measures how quickly a stock's price changes over time.
- Stocks performing well over 3-12 months often continue to do so.
- Momentum strategies work across asset classes and global markets.
- Combining momentum with technical indicators and proper risk management improves reliability.
Momentum trading thrives in trending markets but struggles during volatility or sharp recoveries. Backtesting and automation through platforms like NinjaTrader ensure strategies are tested and executed efficiently. Risk management, such as position sizing and stop-loss orders, is crucial to mitigate sudden reversals.
Momentum offers a systematic way to trade trends, supported by historical data and modern tools, but requires discipline and robust infrastructure for consistent results.
Momentum Trading for Beginners 🚀 (What They Don't Teach You)
Key Momentum Indicators for Stock Analysis
These tools serve as the backbone for crafting effective momentum strategies in stock trading.
Momentum Oscillator and Rate of Change (ROC)
The Momentum Oscillator and Rate of Change (ROC) focus on the price change over a set period, often using a 10-day timeframe. When the value is above zero, it signals bullish momentum, while a value below zero suggests bearish momentum [2][9].
"Market momentum is measured by continually taking price differences for a fixed time interval." - John J. Murphy, Author, Technical Analysis of the Financial Markets [2]
A move above the zero line creates a bullish signal, pointing to increasing upward momentum. On the flip side, a dip below zero indicates bearish momentum, hinting at a weakening stock price [2]. Traders also keep an eye on divergence - when the stock price reaches a new high, but the ROC does not. This often signals a potential trend reversal [9].
Next, the Relative Strength Index (RSI) offers another lens to evaluate momentum by analyzing the speed and magnitude of price shifts.
Relative Strength Index (RSI)
The RSI, a bounded oscillator ranging from 0 to 100, measures the speed and magnitude of recent price movements. Typically calculated over a 14-day period, it strikes a balance between responsiveness and market noise [10][9]. Standard levels for identifying overbought and oversold conditions are set at 70 and 30, respectively [8][10]. An RSI above 70 may indicate that a stock is overbought and due for a pullback, while a reading below 30 suggests it might be oversold and ready for a rebound.
In highly volatile markets, these thresholds can be adjusted [8]. Another key level is 50, which can act as a pivot point; if a stock struggles to cross above 50, it may lack the momentum to sustain an upward move [8]. Rather than acting immediately when RSI hits 30 or 70, seasoned traders often wait for the indicator to move back across these levels to confirm a reversal [10].
With these insights in mind, the MACD adds another layer of depth by analyzing trend strength and direction.
Moving Average Convergence Divergence (MACD)
The MACD evaluates trend strength and direction by comparing two exponential moving averages (EMAs). It’s calculated by subtracting the 26-day EMA from the 12-day EMA. A 9-day EMA, known as the signal line, is then used to generate buy or sell signals [10].
When the MACD line crosses above the signal line, it suggests a potential buy signal. Conversely, a cross below the signal line may indicate it’s time to sell [10]. The MACD becomes even more effective when paired with other indicators, such as the RSI, to confirm whether a stock is overbought or oversold before making a move [8].
How Momentum Affects Stock Performance
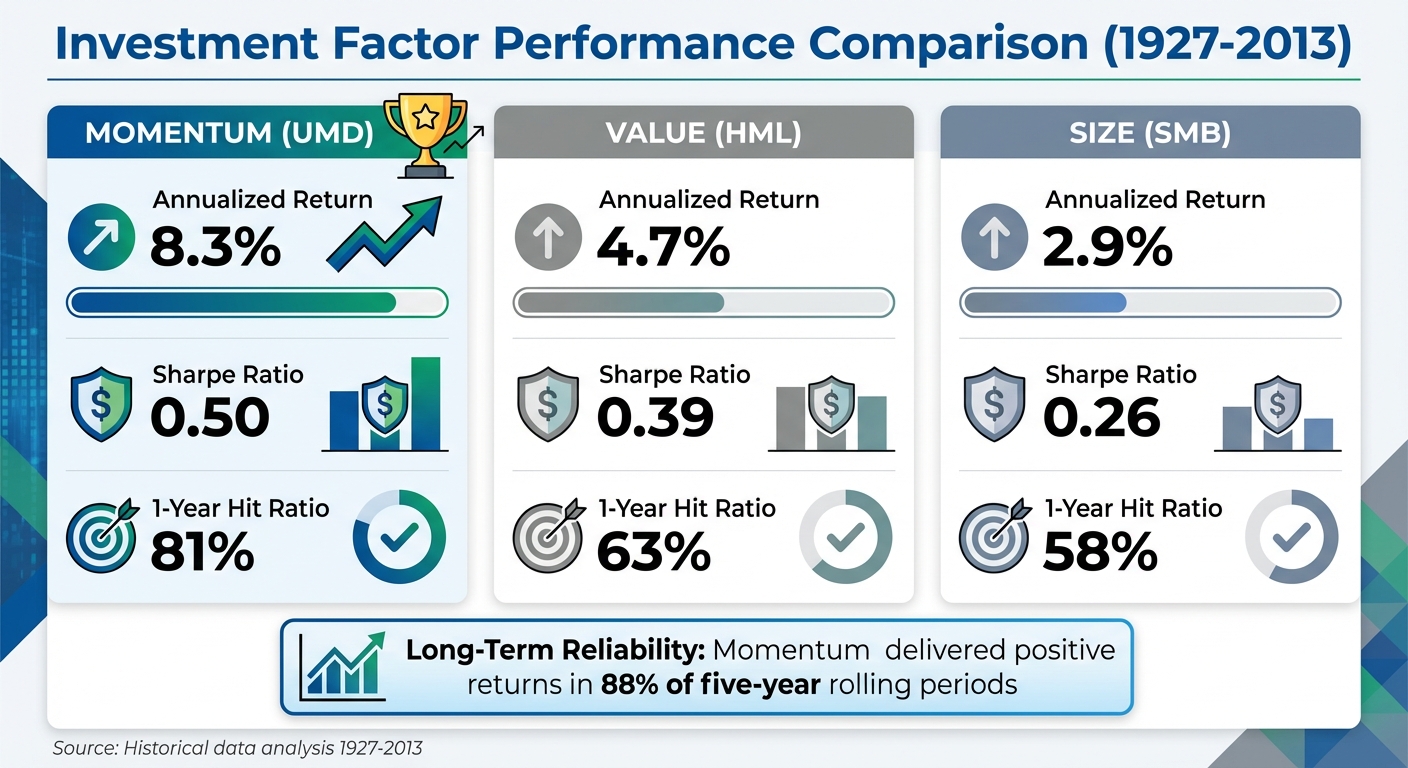
Momentum vs Value vs Size Factor Performance Comparison 1927-2013
Momentum and Trend Persistence
Momentum highlights a simple yet compelling trend: securities that perform well tend to keep performing well, while underperformers often continue to lag for periods ranging from 3 to 12 months [4][5].
"Securities that have performed relatively well (winners) tend to continue to outperform, and securities that have performed relatively poorly (losers) tend to continue to underperform." - Clifford Asness, Managing Principal, AQR Capital Management [5]
A specific type of momentum, called time series momentum, uses a security’s past 12-month performance to predict its future trajectory. This indicator generally holds up for about a year, after which partial reversals often come into play [7]. For traders, this means keeping an eye on timing and adjusting positions as the one-year mark approaches.
Recognizing the persistence of trends helps traders better understand how market conditions influence momentum’s behavior.
Market Conditions and Momentum Performance
Momentum strategies thrive in markets with clear, sustained trends but struggle when conditions turn unpredictable [1]. Historical data shows momentum tends to be more reliable during bull markets, as upward trends often last longer than downward ones [1].
However, high market volatility can complicate things. It can delay buy or sell signals, making traders late to act [1]. Additionally, when trends start to fade, certain indicators - like a stock hitting new highs while its Relative Strength Index (RSI) doesn’t follow - can signal potential reversals [1].
Even with these challenges, momentum has proven to be a consistent performer over the long term. Between 1927 and 2013, the momentum factor (UMD) delivered positive returns in 81% of one-year rolling periods and an impressive 88% of five-year rolling periods [5]. That said, traders should be cautious of "momentum crashes", which can occur during sharp market recoveries after prolonged downturns [5][6].
Backtested Evidence of Momentum's Effectiveness
The reliability of momentum is further supported by extensive backtesting. A study covering 212 years of U.S. equity data (1801–2012) found that momentum isn’t just a U.S. phenomenon - it holds true across more than 40 countries and various asset classes [5][11]. From 1927 to 2013, the momentum factor achieved an annualized mean spread return of 8.3%, outpacing both value (4.7%) and size (2.9%) factors [5]. It also posted a higher Sharpe ratio (0.50) compared to value (0.39) and size (0.26), highlighting its risk-adjusted performance [5].
| Factor (1927-2013) | Annualized Return | Sharpe Ratio | 1-Year Hit Ratio |
|---|---|---|---|
| Momentum (UMD) | 8.3% | 0.50 | 81% |
| Value (HML) | 4.7% | 0.39 | 63% |
| Size (SMB) | 2.9% | 0.26 | 58% |
Momentum's strength extended into an out-of-sample period from 1991 to 2013, where it delivered a 6.3% return, outperforming value, which returned 3.6% during the same timeframe [5]. Notably, momentum isn’t confined to small-cap stocks. It showed strong returns in both large-cap (6.8%) and small-cap stocks (9.8%) [5].
This extensive data underscores momentum’s enduring appeal as a strategy that can adapt across different market environments and asset classes.
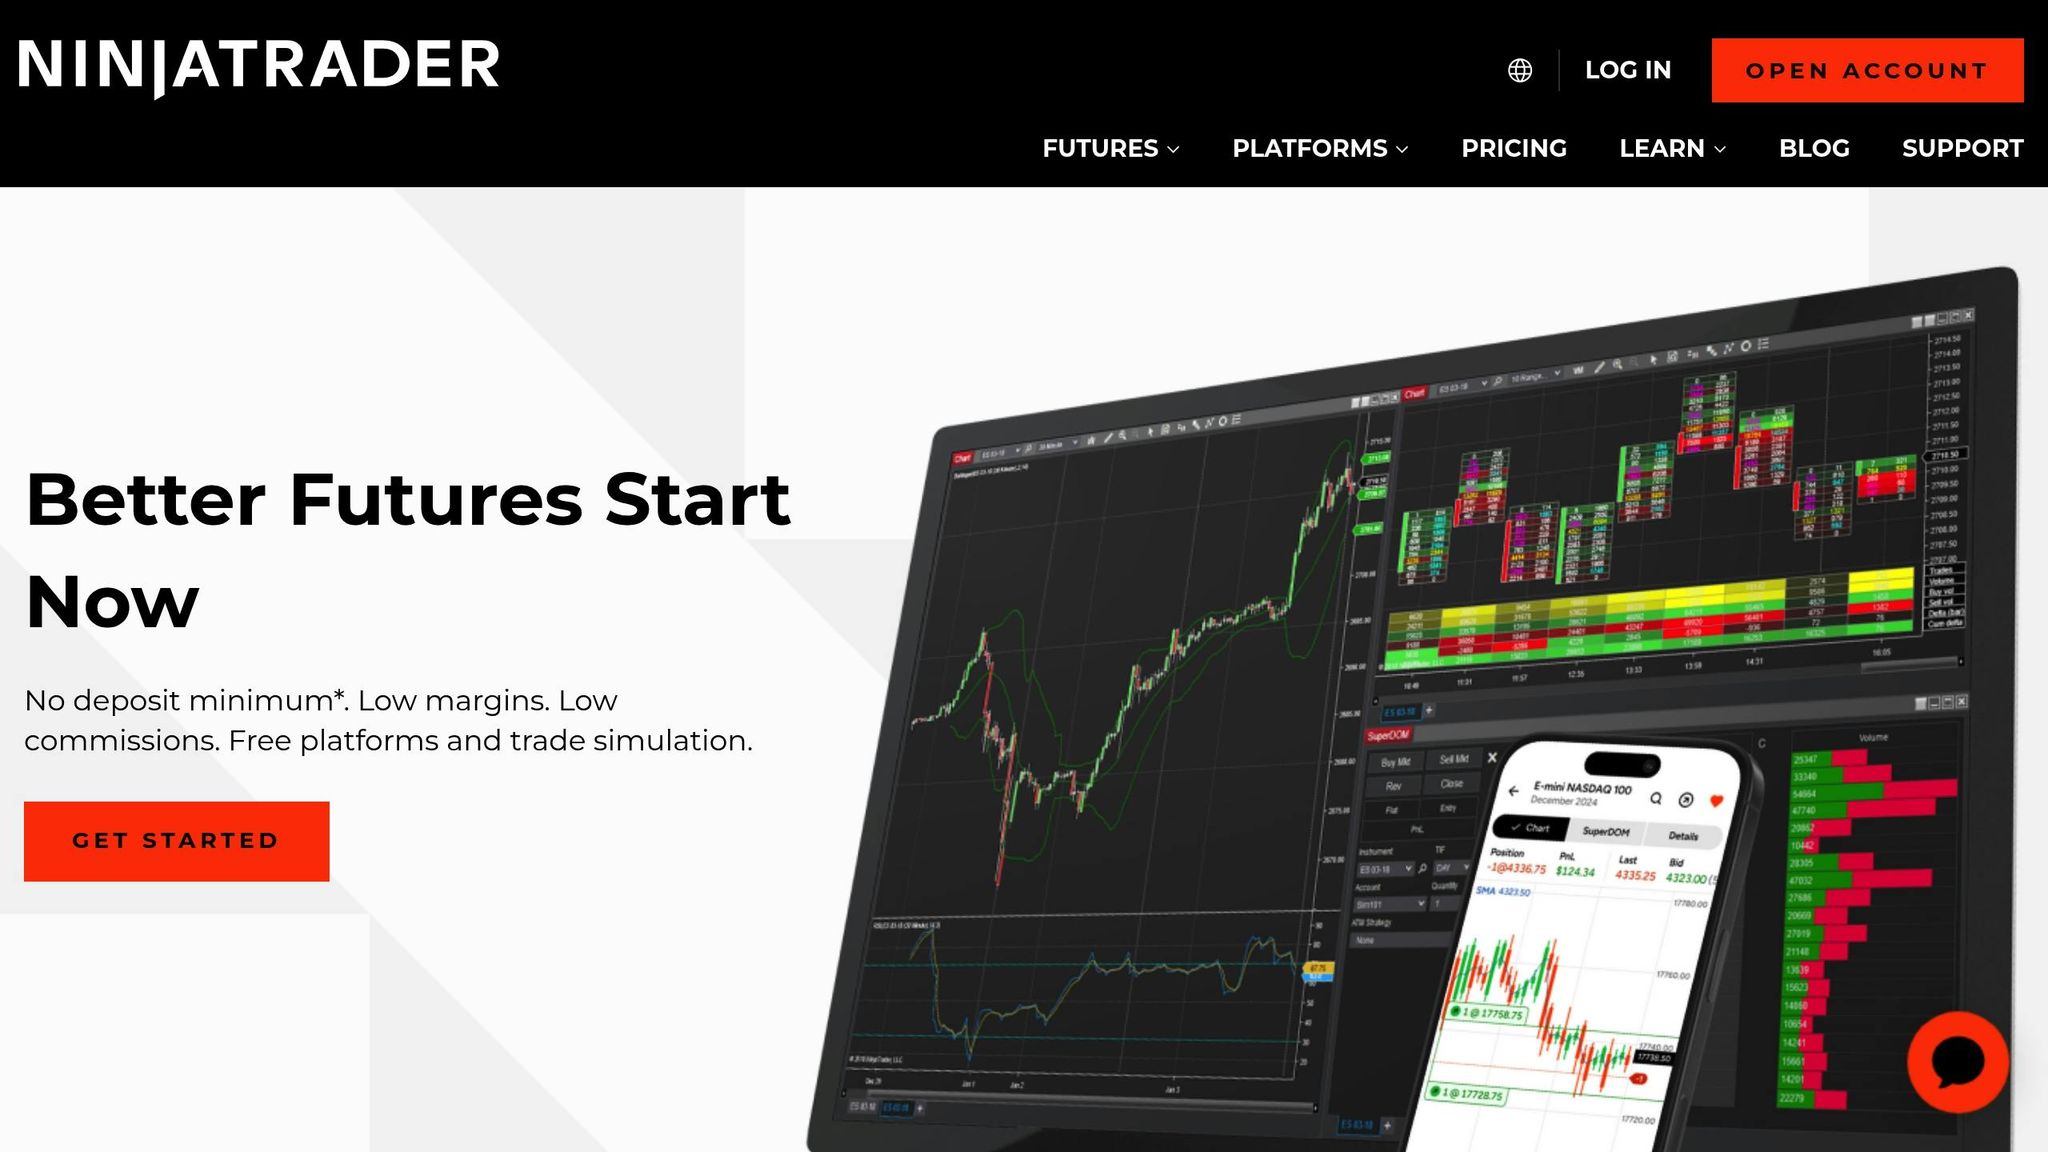
Building Momentum Strategies on NinjaTrader
Designing Rules-Based Momentum Strategies
NinjaTrader makes it easier to create momentum-based strategies using its built-in Momentum indicator. This tool calculates price changes over a chosen period, producing an oscillator that fluctuates around a zero line [12][2].
"The Momentum indicator is both easy to set up and versatile to use. By measuring the amount that a security's price has changed over a given period of time, it indicates a market's velocity and is helpful in spotting likely reversal points." - NinjaTrader [12]
To get started, add the Momentum indicator through the "Indicators" menu and set your preferred time frame. For short-term analysis, a 10-day period is common. Longer periods, such as 14 or 20 days, provide smoother signals by filtering out noise, while shorter periods are more sensitive to reversals but may generate false signals.
Creating a solid strategy involves defining clear entry and exit rules. For instance, when the momentum line moves significantly away from the zero line, it could signal the beginning of a new trend. Conversely, a return toward zero might suggest the trend is losing steam, signaling a potential exit point. To improve accuracy, pair the Momentum indicator with other tools like moving averages, RSI, or MACD [12][1]. For example, combining a 10-day and 25-day moving average crossover with momentum above zero can confirm trend strength and reduce false signals.
Once your rules are set, backtesting is essential to ensure the strategy performs well under different market conditions.
Backtesting and Optimizing Momentum Strategies
Backtesting plays a critical role in refining momentum strategies. With NinjaTrader's Strategy Analyzer, you can test your strategies against historical data before risking any real money. The platform supports free backtesting and includes a trading simulator for practice. Adjusting the "Period" value is particularly important - what works for high-volatility stocks may not be effective for more stable assets like dividend-paying stocks [12].
When backtesting, don’t just focus on profitability. Pay attention to metrics like maximum drawdown and win-loss ratios to ensure your strategy can handle real-world challenges [13]. For example, testing your strategy against volatile conditions - like the market crash in March 2020 - can reveal whether losses stem from flaws in the strategy or extreme market events [13]. Research suggests that momentum strategies tend to perform best when analyzed over 3- to 12-month periods. Additionally, a 12-month lookback for time series momentum has shown predictive reliability across various futures contracts [4][7].
After thorough backtesting and adjustments, the next step is deploying your strategy in live markets with confidence.
Running Momentum Strategies with TraderVPS
Once your momentum strategy is optimized, deploying it through TraderVPS ensures smooth execution and minimal latency. Momentum strategies rely on capturing quick price movements, so fast and reliable execution is crucial. A VPS (Virtual Private Server) reduces slippage by speeding up order execution and also safeguards your automated strategies from disruptions like power outages or internet issues.
TraderVPS provides 99.999% uptime and servers specifically optimized for NinjaTrader. With infrastructure located in key financial hubs like Chicago, it minimizes the physical distance to exchange servers, reducing delays in order execution [14]. This setup also allows you to run backtests and optimizations in the background without affecting live trading. TraderVPS offers flexible plans, from VPS Lite for simple setups to Dedicated Server options for more complex strategies. All plans include 24/7 connectivity, ensuring critical orders like stop-loss and take-profit are managed without interruption, even during local hardware failures [14].
Risk Management for Momentum Trading
Position Sizing and Stop-Loss Placement
Momentum trading comes with the risk of sudden reversals, so managing your exposure is crucial. A good rule of thumb is to risk no more than 2% of your total capital on a single trade [15].
Here’s how to figure out your position size: Start by calculating your account risk. For example, if your account is worth $25,000, 2% risk equals $500. Let’s say you plan to enter a trade at $160 with a stop-loss at $140. The risk per share is $20 ($160 - $140). To stay within your $500 risk limit, you’d buy 25 shares ($500 ÷ $20) [15]. This method ensures that even after 10 losing trades in a row, you’d only lose 20% of your total capital - leaving room to recover.
During periods of high volatility, such as earnings announcements, it’s wise to cut your position size in half to manage risk. This helps protect against "gap risk", where a stock opens significantly lower than its previous close. Standard stop-loss orders won’t shield you from these overnight gaps, so reducing your exposure during uncertain times is a smart move.
Combining Momentum with Trend Filters
Refining your trade signals can further reduce risk. Momentum strategies often produce false signals, especially during volatile market conditions. To improve accuracy, you can combine momentum indicators with trend filters, such as moving averages or trend lines [3]. For example, only take long trades when the overall trend is upward and short trades when the trend is downward.
Pairing momentum with other factors can also improve consistency. Historical data from 1927 to 2013 shows that a 60/40 portfolio split between value and momentum delivered a Sharpe ratio of 0.80, compared to 0.50 for momentum alone and 0.39 for value alone [5]. This blend also increased the likelihood of positive one-year rolling returns to 81%, making momentum returns less erratic [5].
"Critics and mythmakers would do well to remember that even if a factor were sporadic, it's not the sporadicness of one factor that matters, but that of the portfolio, and therefore how that factor contributes to the overall portfolio." - Clifford Asness, Managing Principal, AQR Capital Management [5]
Securing Automated Strategies with VPS Hosting
For traders using automated momentum strategies, reliable infrastructure is key. A missed exit signal during a reversal can erase days of profits. Using VPS hosting ensures your strategies stay active around the clock, even during power outages, internet disruptions, or hardware failures. Fast execution also reduces slippage.
TraderVPS offers features like DDoS protection, automatic backups, and strong cybersecurity protocols, safeguarding your algorithms from technical issues or external threats [14]. Their plans range from VPS Lite for $69/month to Dedicated Server options at $299/month, providing unmetered bandwidth and NVMe storage - ideal for complex strategies and extensive backtesting. Incorporating these tools into your trading setup enhances the reliability of your momentum strategies, making your approach more resilient overall.
Conclusion: Using Momentum to Improve Stock Performance
Momentum trading taps into market trends and investor behavior by focusing on buying assets with upward strength and selling those in decline [16]. Historical data supports its effectiveness, showing that momentum strategies delivered positive returns 81% of the time over one-year rolling periods (1927–2013) with a Sharpe ratio of 0.50 [5]. This consistency underscores the importance of systematic and automated execution.
Platforms like NinjaTrader make systematic execution accessible by automating momentum indicators such as RSI, MACD, and moving averages. This automation removes emotional decision-making from trading, leading to more disciplined entries and exits [17]. Backtesting plays a crucial role in refining strategies - for example, a Nasdaq 100 momentum strategy achieved an 82% win rate with a 5.3% compound annual growth rate (CAGR) [16]. To capture these gains effectively, a robust infrastructure is non-negotiable.
Reliable automation ensures your strategies remain active and responsive. A missed exit during a market reversal can erase days of progress, which is why dependable infrastructure is essential. Services like TraderVPS provide low-latency environments and 24/7 uptime to ensure trades are executed instantly [17]. Plans start at $69 per month for VPS Lite and go up to $299 per month for Dedicated Servers, which offer the capacity for intensive backtesting and multi-monitor setups.
Combining momentum with volume filters and trend confirmations can further refine your approach, helping to differentiate genuine institutional buying from weak price movements [17][18]. Additionally, research from AQR Capital Management reveals that pairing momentum with value strategies can enhance performance, improving the Sharpe ratio from 0.50 (momentum alone) to 0.80 when combined [5]. The conclusion is simple: momentum trading thrives when supported by disciplined risk management and reliable, automated tools.
FAQs
How do momentum strategies perform during periods of market volatility?
Momentum strategies have demonstrated their strength, often standing out during periods of market volatility. Studies suggest that these strategies can yield impressive returns, even when markets face significant uncertainty or turmoil.
The success of momentum lies in its knack for leveraging ongoing trends, which often continue despite market disruptions. That said, like any investment approach, outcomes can differ, and it's crucial to adjust strategies in response to shifting market conditions.
How important is risk management in momentum trading?
Risk management plays a key role in momentum trading since this approach often focuses on stocks with sharp price swings. To safeguard their capital while pursuing potential profits, traders implement measures like setting position size limits, using stop-loss orders, and applying volatility-based filters. These tools help minimize losses when markets take an unexpected turn.
Momentum traders also keep a close eye on risk metrics like the Sharpe Ratio. This helps them evaluate whether the returns they’re chasing are worth the risks involved. By incorporating these risk controls into their trading strategy, they maintain discipline, limit unnecessary exposure, and work toward making momentum trading a steady and profitable endeavor.
Is momentum trading effective across different types of investments?
Momentum trading has proven effective across a range of asset classes. Research consistently shows that assets outperforming their peers often maintain that trend. This pattern has been observed in stocks, bonds, commodities, currencies, and even alternative investments.
In fact, studies suggest that systematically applying momentum strategies with discipline can lead to better risk-adjusted returns. Whether you're trading equities, futures, forex, or fixed-income products, momentum can be a valuable approach to enhance decision-making and boost profitability.


