
Systematic Trading Fundamentals: Ideas, Tactics, and Cases
Systematic trading relies on pre-defined rules and algorithms to execute trades, removing emotional biases and ensuring consistency. This approach is particularly effective in fast-moving markets like U.S. futures, where automation plays a critical role. Key strategies include trend following, mean reversion, volatility breakouts, seasonality patterns, and spread trading. Each strategy emphasizes disciplined execution, rigorous backtesting, and robust risk management. Tools like NinjaTrader and VPS services help traders automate and optimize their strategies for maximum efficiency.
Key Takeaways:
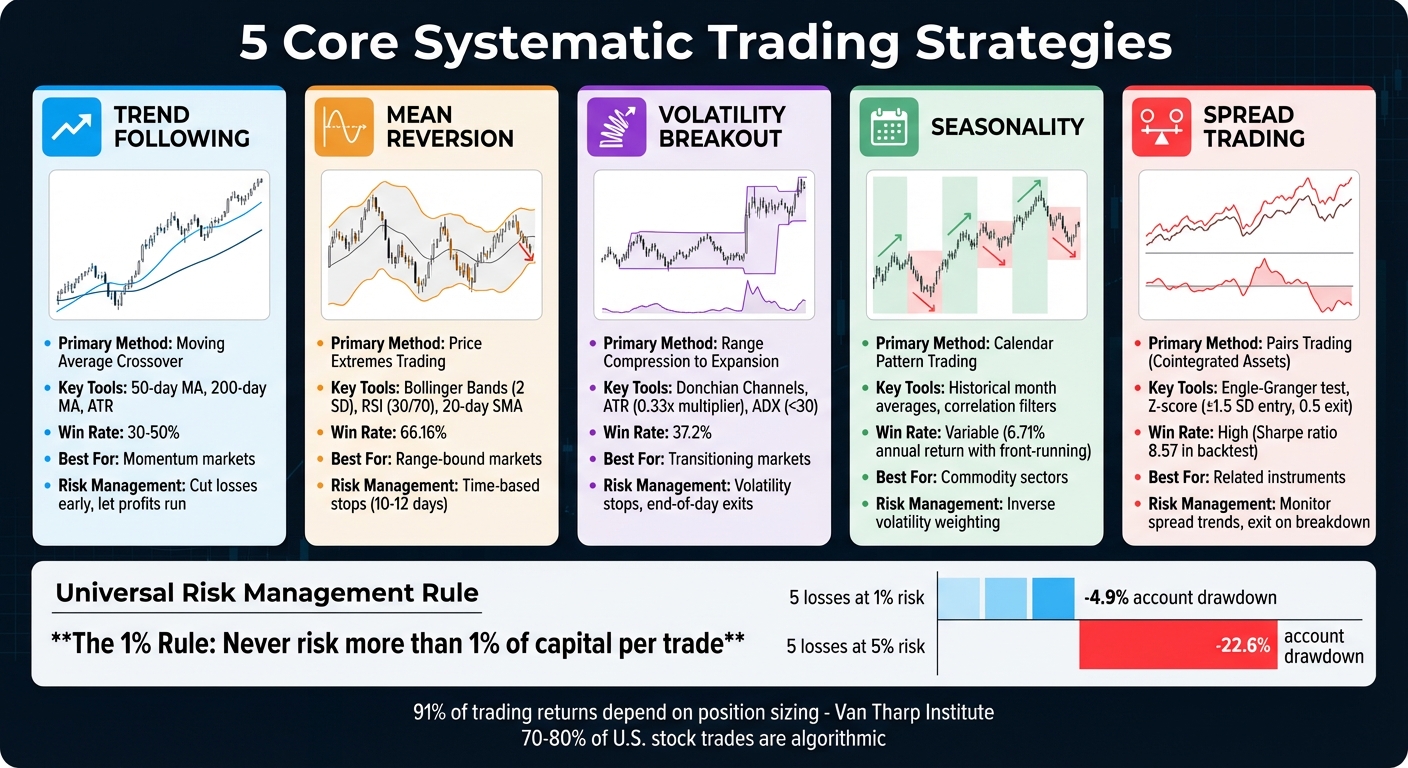
- Trend Following: Focus on momentum using moving average crossovers. Success depends on strict risk management and letting profits run.
- Mean Reversion: Utilize Bollinger Bands and RSI to spot price extremes and trade reversals.
- Volatility Breakouts: Identify range compressions and trade directional moves using tools like ATR and Donchian Channels.
- Seasonality Patterns: Time trades around predictable calendar-based cycles in commodities and equities.
- Spread Trading: Exploit relationships between assets, such as pairs trading with cointegrated instruments.
- Risk Management: Limit risk per trade to 1% of capital and adjust position sizes based on market volatility.
Automation ensures precision but requires active monitoring to address technical issues and market changes. Platforms like NinjaTrader streamline execution, while VPS services minimize downtime and latency.
5 Systematic Trading Strategies Comparison: Methods, Tools, and Win Rates
1. Trend Following Strategies
Moving Average Crossover Systems
Trend following strategies aren’t about predicting where prices will go. Instead, they focus on identifying an existing trend and sticking with it until the trend reverses [5]. A popular method within this approach is the moving average crossover. Here’s how it works: a trader enters a position when a shorter-term moving average (like the 50-day) crosses above a longer-term moving average (like the 200-day). The goal? To ride the momentum as long as it lasts [6]. But the key to success lies in disciplined execution and careful trade management.
This strategy, while appealing, typically sees win rates in the range of 30% to 50% [7]. The secret to making it work? Cutting losses early with strict stop-loss orders and letting profitable trades run their course. As Van Tharp points out, a staggering 91% of trading returns come down to how you size your positions [6]. This highlights the importance of risk management, a cornerstone of systematic trading that thrives on objectivity and consistency.
Some real-life success stories show just how powerful disciplined trend following can be. For instance, David Harding turned an initial $2 million into a firm managing $20 billion [6]. Similarly, Ed Seykota grew a $5,000 account into $15 million over 12 years by sticking to systematic trading rules [6].
Tom Basso, a seasoned trend follower, stresses the importance of acting on every system signal - even after facing losses. Missing just a few big winners, he warns, can severely impact profitability [5][7].
For U.S. futures traders, automated trading systems can take the emotional element out of the equation. Tools like NinjaTrader can execute moving average crossover strategies while incorporating indicators like ATR to adjust position sizes and set stop-loss levels automatically. This makes it easier to stick to the rules without second-guessing every move.
2. Mean Reversion Strategies
Bollinger Bands and RSI Combinations
While trend-following strategies thrive on sustained market momentum, mean reversion strategies focus on capitalizing on temporary price extremes. These strategies operate on the principle that prices that stray too far from their average eventually return to it [8]. Unlike trend-following, which chases momentum, mean reversion seeks out overextensions - those moments when fear or greed drives prices to unsustainable levels. Research indicates that 60% to 80% of stocks experiencing extreme short-term deviations from their average price revert within weeks [11].
The process is relatively simple. Start by establishing a baseline with a 20-day simple moving average or VWAP (Volume Weighted Average Price). Then, use Bollinger Bands (set at 2 standard deviations) or RSI levels below 30/above 70 to identify price extremes [8][10][12]. When prices breach the outer Bollinger Band and RSI confirms the extreme, it signals a potential trade setup.
Take October 2023 as an example: E-mini S&P 500 futures spiked nearly two standard deviations above their 20-day moving average after JPMorgan Chase & Co. reported stronger-than-expected earnings. Traders applying mean reversion principles entered short positions as the price moved back within the upper Bollinger Band. This allowed them to capture the return toward the 20-day average as market sentiment stabilized [10]. This example highlights how volatility in futures markets can create frequent opportunities for systematic mean reversion trades.
However, mean reversion strategies tend to falter during strong market trends. Backtesting on the Russell 1000 index from 2000 to 2025 showed a 66.16% win rate and an annual return of 14.47% [9]. But these results were achieved by avoiding trades during strong momentum moves. A 200-day moving average can act as a trend filter: avoid short trades when prices remain above this level, even if overbought signals are present [9][10]. As the NinjaTrader Team explains:
"Mean reversion is the belief that asset prices and historical returns eventually revert to their long-term mean or average" [8].
That belief, however, hinges on recognizing when the market conditions align - or don’t.
For U.S. futures traders, automated tools and platforms can add efficiency. These systems can monitor multiple contracts, calculate Z-scores (values exceeding ±2.0 indicate tradable extremes), and execute trades instantly [12][14]. Since not all mean reversion trades pan out, using time-based stops is crucial. Exiting positions after 10 to 12 days can free up capital from stagnant trades [13]. Up next, we’ll explore volatility breakout strategies to further expand systematic trading approaches.
3. Volatility Breakout Strategies
Donchian Channels and ATR-Based Entry Levels
Volatility breakout strategies are designed to capitalize on market transitions from calm, range-bound phases to strong directional movements. The principle is straightforward: after a period of low volatility, markets often experience an expansion, which could mark the beginning of a new trend [18].
The process involves spotting phases of range compression. Tools like Bollinger Bands help identify "squeezes", where the bands contract, signaling reduced volatility. An ADX reading below 30 further confirms a range-bound market [18]. A breakout occurs when the price closes above the upper Donchian Channel or surpasses the previous close by 0.33 times the 14-period ATR. This ATR-based method dynamically adjusts entry levels to align with current market conditions, rather than relying on static price points [15][16].
A compelling example of this strategy in action comes from the QuantMonitor project by Lukas Melka and ALLFYZ21 GROUP s.r.o. Between September 2024 and January 2025, they utilized trend slope indicators alongside volatility filters to pinpoint "Up_LowVol" regimes - bullish conditions marked by below-average volatility. Over a 112-day span ending January 16, 2025, the strategy delivered a total return of +103.4%, with a profit factor of 1.28 and a win rate of 37.2%. The system remained active 95.5% of the time during favorable conditions [17].
Automation plays a critical role in ensuring precision and consistency in systematic trading. Platforms like NinjaTrader allow traders to automate strategies by configuring key parameters - such as the instrument and bar interval - through the Desktop Control Center's "Strategies" tab [1]. However, as the NinjaTrader Team cautions:
"Automation doesn't mean 'set it and forget it.' ... strategy automation requires active monitoring, because of unforeseen things that can (and will) go wrong" [1].
To maintain uninterrupted system performance, running strategies on one of the best VPS providers for futures trading is highly recommended. This ensures near-constant uptime, as top-tier providers aim for 99.999% reliability, reducing the risk of local outages [3][19].
A volatility stop can help distinguish real breakouts from false signals. For example, setting the stop at the session high plus an ATR multiplier can provide a critical threshold. If the price breaks above the initial level but fails to clear this volatility stop, it may indicate a false breakout, prompting traders to "fade" the move by taking an opposing position [16]. For intraday futures trading, a fixed end-of-day exit can simplify execution and mitigate overnight gap risk [15].
Next, we'll delve into how seasonality-based strategies can add another layer of diversification to systematic trading approaches.
4. Seasonality-Based Strategies
Front-Running Calendar Patterns in Commodity Sectors
Seasonality-based strategies leverage predictable price patterns tied to specific calendar periods, like agricultural harvests, heating demands, or year-end portfolio adjustments. These cycles are driven by supply and demand shifts, making precise timing essential. When used alongside other systematic strategies, seasonality offers a timing advantage rooted in the calendar.
Cyril Dujava from Quantpedia examined this concept by analyzing four commodity sector ETFs - DBA (Agriculture), DBB (Base Metals), DBE (Energy), and DBP (Precious Metals) - over the period from 2007 to 2024. A straightforward approach of buying during historically strong months resulted in a disappointing -4.54% annual return and a massive -60.26% drawdown. However, adjusting the entry point to one month earlier turned the strategy around, delivering a 6.71% annual return and reducing drawdowns to -20.43% [20].
"By front-running these seasonal trends - buying sectors with expected positive performance... before their favorable months begin - you can potentially gain a significant edge over traditional seasonality-based strategies." - Cyril Dujava, Quant Analyst, Quantpedia [20]
Adding a correlation filter further fine-tuned the strategy. When short-term intra-market correlations dropped below their long-term averages, signaling increased market dispersion, the performance improved significantly. This adjustment boosted the Sharpe ratio from 0.55 to 0.81 [20].
Nick Baltas explored a similar concept by analyzing commodity and equity indexes from 1975 to 2014. His findings revealed that a long/short strategy based on 10-year calendar month averages achieved Sharpe ratios of 0.49 for commodities and 0.45 for equities. However, high turnover presented a challenge, as transaction costs exceeding 0.25% could erode the strategy's edge [21].
The key takeaway? Seasonality works best as a timing overlay rather than a standalone signal. Techniques like inverse volatility weighting can help balance risk across positions, while walk-forward analysis ensures parameters remain robust and not overly reliant on historical data. These methods highlight the value of seasonality as a complementary tool within systematic trading strategies [21][3].
5. Spread and Relative Value Strategies
Pairs Trading with Cointegrated Energy Futures
Spread and relative value strategies tap into the relationships between different assets, aiming to profit from their interactions. The idea is straightforward: when two historically connected instruments move apart, you short the stronger performer, go long on the weaker one, and wait for the spread to close again [22].
For example, between April 1 and May 15, 2024, a pairs trading strategy was tested on CME WTI Crude Oil (CL) and ICE Brent Crude Oil (BRN) using 1-minute data. This strategy used the Engle-Granger two-step cointegration test to confirm a stable long-term relationship between the two assets. Positions were taken when the z-score exceeded 1.5 standard deviations, with exits triggered at 0.5. After accounting for NYMEX corporate member fees ($0.70 per side) and realistic slippage, the backtest achieved an impressive Sharpe ratio of 8.57 [23].
Unlike correlation, which only measures how two assets move together, cointegration digs deeper. It ensures that the price difference between the two remains consistent over time, making the spread more likely to revert to its mean [23].
"Pairs trade is a substantially self-funding strategy, since the short sale proceeds may be used to create the long position." - Wikipedia [22]
However, managing risk is critical. If the spread begins to trend rather than revert, it could signal a breakdown in the historical relationship, and exiting the trade becomes necessary. Additionally, factors like bid-ask spreads and commissions can impact performance, potentially shaving 5–30 basis points off the Sharpe ratio [24].
6. Risk Management and Position Sizing
The 1% Rule with Volatility-Adjusted Position Sizing
When it comes to systematic trading, the real key isn't about finding the perfect entry signal. Instead, it’s all about managing your risk per trade. Research from the Van Tharp Institute reveals that 90% of the performance differences among professional traders come down to their position sizing strategies - not their entry signals [29].
The core principle? Never risk more than 1% of your total trading capital on a single trade [25]. This rule is designed to protect your account from significant losses. Let’s break it down: with a $10,000 account, risking 1% means you’re only putting $100 on the line per trade. Even after five consecutive losing trades, your account would only drop by 4.9%. Compare that to a 5% risk per trade, which would result in a 22.6% loss over the same five trades [25]. The difference is striking.
To calculate position size, divide your total risk (in dollars) by the per-unit risk. For instance, if you’re entering a futures trade at $160 with a stop-loss at $140, the per-unit risk is $20. With a $10,000 account risking 1% ($100), your position size would be 5 contracts ($100 ÷ $20) [26][27].
But markets are rarely static, and volatility can significantly impact risk. To adapt, adjust your position size based on market conditions. For example, during periods of high volatility, use the Average True Range (ATR) to scale down your positions. This ensures your dollar risk remains consistent, even when price swings are more dramatic. Some traders go a step further, halving their position sizes during major economic events to avoid the risks associated with price gaps [26][27][28].
Disciplined position sizing isn’t just a safety net - it’s a cornerstone of effective systematic trading.
"You don't get paid for taking risks; you get paid for managing them well. The market doesn't reward bravery without discipline." - TradeReview [25]
To complement your position sizing, stick to strict trading rules. For instance, consider a "cool-down" approach: stop trading after three consecutive losses or if you hit a daily loss limit. This can help you avoid emotional, impulsive decisions [25]. Also, keep a detailed trading journal. Track metrics like your average risk/reward ratio, profit factor, and maximum drawdown. This not only highlights areas for improvement but helps you spot potential problems before they spiral out of control [25].
033 - Rob Carver - The Comprehensive Guide to a Diversified Futures Strategy
Conclusion
Systematic trading isn’t about trying to nail perfect entries or predicting every market move. It’s about creating a disciplined framework that strips away emotion, ensures consistency, and allows you to manage decisions across multiple markets at once. Whether you’re working with trend-following strategies on E-mini S&P 500 futures or mean-reversion setups on crude oil, the real advantage lies in automation, meticulous testing, and reliable infrastructure. This approach ties together techniques like trend following and mean reversion, as discussed earlier.
Here’s a striking fact: Between 70% and 80% of trades on U.S. stock exchanges are now executed by algorithmic systems, and about 70% of daily forex transactions are automated [30]. For futures traders, the stakes are even higher - markets move so fast that even the slightest delay can eat into profits. To stay competitive, tools like a dedicated VPS with 99.999% uptime - strategically located near Chicago exchanges - can ensure your strategies run smoothly without interruptions [4]. As of December 29, 2025, professional VPS setups are a critical support system for traders who depend on reliable tools [4].
The NinjaTrader Team highlights the importance of automated discipline in their statement:
"Automating a trading strategy can be a game changer for traders struggling with consistent profitability. It allows you to better follow your plan with improved discipline." - NinjaTrader Team [1]
NinjaTrader serves as the foundation for this structured approach, offering tools like the Strategy Analyzer for backtesting, NinjaScript for coding precise rules, and a Control Center for real-time trade execution [2][1]. However, automation isn’t a “set it and forget it” solution. It demands regular monitoring to address software glitches, connectivity problems, and changing market conditions. The ultimate goal? To enforce discipline while keeping you at the helm as the system’s architect [3].
FAQs
How does automation enhance the reliability of systematic trading strategies?
Automation enhances the dependability of systematic trading by ensuring trades are carried out precisely according to set rules. This approach removes emotional decision-making from the equation and minimizes the chance of human mistakes, like poorly timed entries or exits.
With automated strategies, traders can maintain consistent, repeatable outcomes even as market conditions shift. Additionally, automation allows for quicker execution, enabling strategies to seize opportunities instantly without the delays that come with manual processes.
Why is risk management essential for successful systematic trading?
Risk management plays a key role in systematic trading by safeguarding your capital, minimizing losses, and supporting the longevity of your strategy. Establishing clear guidelines for risk-to-reward ratios, position sizing, and stop-loss levels allows traders to handle inevitable losses while staying prepared to take advantage of profitable trades. This structured approach also helps reduce emotional decisions, which can often derail trading performance.
Another critical aspect of risk management is ensuring that strategies are resilient and not merely tailored to past data. Tools like maximum drawdown and volatility-adjusted metrics enable traders to track performance and automatically adjust their exposure when certain risk limits are reached. This disciplined approach is what turns a well-crafted algorithm into a trading system that can deliver consistent results over time.
How can I incorporate seasonality patterns into systematic trading strategies?
Seasonality refers to recurring market patterns that align with specific calendar events, such as certain days of the week, months of the year, or holidays. To incorporate these trends into a systematic trading strategy, start by diving into historical data to uncover patterns that are statistically reliable. For instance, you might calculate average returns for particular periods, like the first trading day of each month, to see if they consistently offer a favorable edge.
Once you've pinpointed a dependable seasonal trend, it can be built into your trading system as a signal or filter. For example, your strategy might focus on initiating trades only during times with a strong seasonal bias or adjust position sizes based on the trend's intensity. Integrating these insights with your main strategy ensures that seasonal patterns complement your broader trading approach.
Before deploying the strategy, it's essential to validate it through thorough backtesting and out-of-sample testing to prevent overfitting. Evaluate its performance using metrics like annualized returns or the Sharpe ratio to gauge how well it holds up under varying market conditions. With careful analysis, testing, and integration, seasonality can add a valuable layer to your systematic trading toolkit.


