
Lower Lows and Highs: Trading Implications Explained
Understanding Lower Lows (LL) and Lower Highs (LH) is essential for analyzing bearish market trends. These patterns help traders identify downtrends, reversals, and key levels for entries and exits. A lower low occurs when the price drops below its previous low, signaling increased selling pressure. A lower high forms when a price rally fails to exceed its prior peak, indicating weaker buying momentum. Together, these create a staircase-like structure visible across various markets and timeframes.
Key takeaways:
- LL/LH Patterns in Trading: Useful for spotting bearish trends and identifying short opportunities.
- Automation: LL/LH patterns are ideal for automated systems due to their clear, rule-based criteria.
- Futures Trading: These patterns often highlight institutional activity, such as liquidity sweeps and inducements.
- Risk Management: Stop-loss orders should be placed above recent lower highs to protect against trend invalidation.
- Backtesting: Historical data shows that strategies using LL/LH patterns can yield consistent results, especially when combined with volume analysis or momentum indicators.
For manual or automated trading, LL/LH patterns offer clarity in market structure, making them a reliable tool for decision-making. By combining these patterns with tools like Fibonacci retracements, RSI, or advanced coding platforms like NinjaScript, traders can refine strategies for better results.
Understanding Market Structure For Trading
How LL and LH Reveal Market Structure
Market Structure Patterns: Downtrend vs Uptrend vs Consolidation Trading Signals
Using LL and LH to Identify Trends
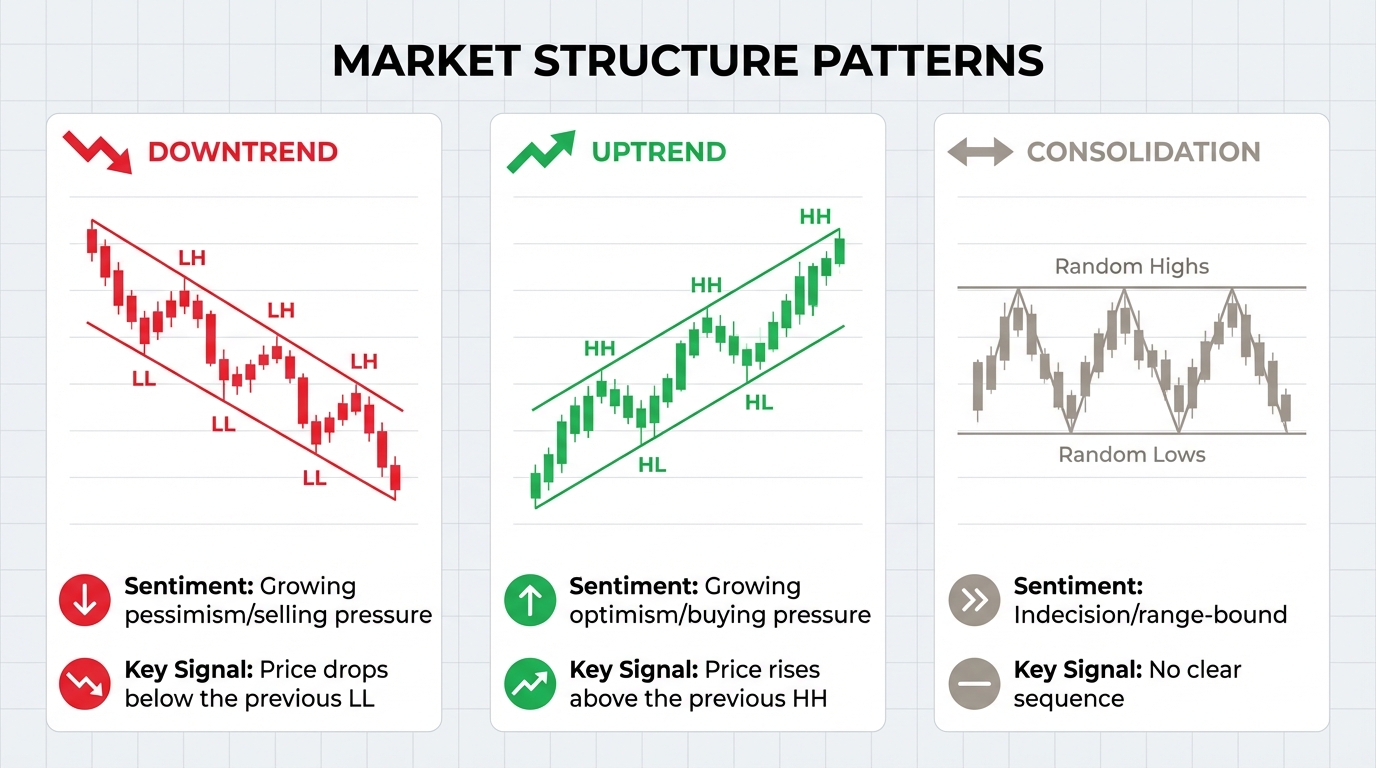
A downtrend becomes apparent when you spot two consecutive lower highs (LH) and lower lows (LL) [5]. This sequence shows that sellers are dominating, while buying pressure weakens. Each peak is lower than the last, and each trough descends further, creating a clear downward staircase. On the flip side, an uptrend is marked by higher highs (HH) and higher lows (HL). If this pattern breaks, it could hint at a potential reversal. When the market lacks a clear LL/LH or HH/HL structure, it often signals consolidation. These patterns provide a foundation for understanding market momentum and identifying key support and resistance levels.
| Market Structure | Pattern | Sentiment | Key Signal |
|---|---|---|---|
| Downtrend | Lower Highs (LH) & Lower Lows (LL) | Growing pessimism/selling pressure | Price drops below the previous LL |
| Uptrend | Higher Highs (HH) & Higher Lows (HL) | Growing optimism/buying pressure | Price rises above the previous HH |
| Consolidation | Random highs and lows | Indecision/range-bound | No clear sequence |
Momentum and Support/Resistance Levels
Lower highs often signal weakening bullish momentum and serve as resistance zones where liquidity tends to gather. A valid lower low is confirmed when the market briefly moves above a minor swing high before sharply breaking lower - this is known as an inducement sweep. Such moves help filter out false breakouts [2]. Traders frequently set stop-loss orders just above these critical levels, which often align with key zones like bearish Order Blocks or Fair Value Gaps [2][3].
Trend Reversals and Mixed Patterns
Momentum and structural details also shed light on trend reversals and more complex patterns. A "Change of Character" (CHOCH) occurs when the price breaks above the most recent lower high in a downtrend, signaling a potential shift in the trend [2]. As Abdullah Shah puts it:
"Lower high is the last highest point of a price retracement which is lower than the previous high. In bearish market analysis, these two elements are combined to understand selling pressure and market pessimism" [2].
However, not every pullback signifies a reversal. If the price retraces but fails to break the structural high (or low), the trend remains intact [5]. That said, a "Deep LL-HH rotation" - a sharp lower low followed by a strong move reclaiming the previous high - has historically led to reversals with at least a 5R return in over 50% of cases [7].
Combining LL/LH patterns with tools like the Relative Strength Index (RSI) can add further clarity. For instance, an extremely low RSI near support during a series of lower lows might signal a high-probability reversal [6]. Understanding these patterns not only sharpens manual trading strategies but also boosts the accuracy of automated trading platforms, such as those built using NinjaScript on TraderVPS.
Trading Strategies Using LL and LH Patterns
Manual Trading with LL and LH
For discretionary traders, confirmation is key when trading with Lower Low (LL) and Lower High (LH) patterns. In a downtrend, short positions are typically entered during a pullback to a lower high. A popular entry point is the 61.8% Fibonacci retracement level, which aligns with support and resistance analysis and tools like Order Blocks or Fair Value Gaps [5].
To safeguard trades, place stop-loss orders just above the most recent lower high. This protects against invalidating the trend. As Oreoluwa Fakolujo explains:
"The lower high is more reliable than the low when it comes to preserving the downtrend... the moment we get a new high that surpasses the most recent lower high, the downtrend is in danger" [5].
Profit targets are often set at the next lower low or liquidity zone, maintaining at least a 1:1.5 risk-to-reward ratio [5]. Timeframe alignment is also critical - use weekly or monthly charts to identify the overall trend, then switch to short-term charts like 1-minute or 5-minute for precise entries [4]. These principles also form the foundation for automated trading systems, discussed below.
Coding LL and LH in Automated Systems
Automating LL and LH patterns requires precise logic for detecting swing points. Tools like NinjaScript offer built-in methods such as HighestBar and LowestBar, which help identify price extremes over a given period. Alternatively, you can create variables (e.g., myHighPrice) to track structural points across historical data [9].
To filter out noise, implement a Swing Period parameter, which defines the minimum number of bars separating swings. Use "protected swings", where a high is confirmed only after the price closes below a valid swing low [8]. As NinjaTrader Customer Service (NinjaTrader_Jesse) explains:
"You could use HighestBar and LowestBar for this type of use case, these methods take a series like the High or Low series and check what the highest/lowest bars were within a period" [9].
Automated systems can also code structural events like Break of Structure (BOS) for trend continuation and Market Structure Shift (MSS) for potential reversals [8]. For best results, run swing detection on a higher timeframe, such as 1-hour, while executing trades on a lower timeframe like 15-minute charts. This ensures that entries align with the broader market structure defined by LL/LH patterns [8]. Using a reliable service like TraderVPS minimizes latency, allowing systems to respond quickly to changes in structure.
Risk Management with LL and LH
Whether trading manually or through automation, risk management is non-negotiable. Stop-loss orders should be placed just above the recent lower high to mitigate the risk of stop hunts [3][5]. If the price breaks above this level, the trend is invalidated, signaling a Change of Character [5].
A helpful tactic is waiting for an inducement sweep, where the price briefly moves above a minor high to trap early sellers, before confirming a valid lower low [2]. This reduces the chances of falling for false breakouts.
Position sizing becomes especially important during sharp LL-LH rotations, which can retrace anywhere from 30% to 70% of the prior move [7]. Backtesting on the S&P 500 (SPY) revealed that requiring three consecutive days of lower highs and lower lows reduced maximum drawdown to 9.9%, while improving average gains [1]. As Abdullah Shah points out:
"Structure analysis in trading is combined with trading strategies. However, no strategy guarantees success because markets are influenced by unforeseen events. Always combine technical analysis with risk management" [2].
For added precision, combine LL/LH patterns with momentum oscillators like RSI to identify overbought or oversold conditions before entering trades [6]. For automated systems, these filters can be coded into NinjaScript, ensuring trades are executed only when all criteria are met.
Tools and Infrastructure for LL and LH Trading
Indicators for Finding LL and LH
To identify Lower Lows (LL) and Lower Highs (LH), traders often rely on tools like the ZigZag and Swing indicators, which help cut through market noise by highlighting key trend changes [12]. If you're using NinjaTrader, the Protected Highs & Lows indicator is particularly useful. It pinpoints "protected swing pivot points" to detect Market Structure Shifts (MSS) and Break of Structure (BOS). You can access a free version of this tool by signing up for a basic account at automated-trading.ch [8][11].
Another popular choice is the Swing Trend (PriceActionSwing) indicator, which identifies patterns such as HH (Higher Highs), LH, LL, and HL (Higher Lows). It offers four calculation methods: Standard, Gann, Ticks, or Percent [13]. For installation, download the .zip file and use the Tools > Import > NinjaScript Add-On option in NinjaTrader's Control Center [10].
Fine-tuning the "Swing Strength" parameter can help manage noise. Lower values (1-4) are ideal for scalping, while higher values (14+) highlight major market swings [8][13]. Volume confirmation is key: a high volume spike at a swing low often signals strong buying interest, while high volume at a swing high suggests strong selling pressure [12]. Keep in mind, ZigZag-based indicators are lagging - they confirm reversals only after the price has moved in the opposite direction for several bars [12][13].
These settings serve as a foundation for coding precise detection rules tailored to your trading strategy.
Programming LL and LH Detection in NinjaScript
When programming LL/LH detection in NinjaScript, start by defining your swing calculation logic. You can choose between Standard, Gann, Ticks, or Percent formulas, and set a Swing Period to determine how many bars must separate two swings of the same type to reduce false signals [8][13].
To automate detection, use Data Series like SwingDuration, SwingHeight, and SwingPercent. These can be integrated into tools such as BloodHound or BlackBird [13]. Some versions of the PriceActionSwing indicator even have unnecessary code sections removed to improve performance in automated setups [13]. For accurate results, ensure you're loading enough historical data - for example, 15 days of data is recommended for weekly levels [10].
While most indicators work well on standard timeframes, they tend to perform best on fast-moving range or volume charts, which better capture price action shifts [13]. For multi-timeframe analysis, identify swing points on higher timeframes (e.g., 1-hour) and use them to confirm trends when trading on lower timeframes (e.g., 15-minute) [8][11].
Why VPS Matters for LL and LH Strategies
Once you've set up your detection tools and coding strategies, the next step is ensuring you have the right infrastructure to execute your trades effectively. For LL/LH strategies, low-latency trading infrastructure is critical for precise execution.
Automated strategies require constant, high-speed monitoring of market structures to identify key levels like "inducement" and "breaks of structure" in real-time [2]. This is especially important when working with short-term timeframes, such as 1-minute or 5-minute charts [4][14]. Relying on a local PC can be risky due to potential power outages, connectivity issues, or higher latency.
A Virtual Private Server (VPS) offers a more reliable solution. For example, TraderVPS provides 24/7 enterprise-grade network connections and low-latency execution near financial hubs like Chicago. Their high-performance VPS solutions can achieve latency as low as 0.52ms to the CME Group exchange [15].
- For basic LL/LH detection on 1-2 charts, the VPS Lite plan ($69/month) includes 4 AMD EPYC cores and 8GB RAM.
- If you're monitoring 3-5 charts with multi-timeframe analysis, the VPS Pro plan ($99/month) offers 6 cores, 16GB RAM, and support for up to 2 monitors.
- For intensive tasks like backtesting and system optimization, the VPS Ultra plan ($199/month) provides 24 cores, 64GB RAM, and supports 5-7 charts across up to 4 monitors.
All plans come with Windows Server 2022, NVMe storage, and unmetered bandwidth, ensuring your automated strategies run smoothly without interruptions.
Testing and Monitoring LL and LH Strategies
Backtesting and Optimization
When working with LL (Lower Low) and LH (Lower High) patterns, backtesting is essential to confirm their effectiveness in your chosen markets [1][17]. Experiment with different holding periods to identify optimal results. For instance, a backtest on the S&P 500 (SPY) revealed that a 10-day holding period following a lower high and lower low pattern produced an average gain of 0.47%, compared to just 0.09% for a 1-day exit [1]. This highlights how the choice of holding period can significantly influence outcomes. Tools like NinjaTrader’s optimization functions allow you to test exit strategies ranging from 1 to 10 days, helping you pinpoint the best timeframe for your specific asset [1].
The consistency of signals improves with consecutive LL and LH occurrences. A study updated in May 2024 by Quantified Strategies tested a "three consecutive lower lows and lower highs" approach on the S&P 500. Their findings showed that entering at the close of the third day and exiting after a brief holding period resulted in a higher profit factor and a more stable drawdown [1][17].
To avoid overfitting, test your strategy across various asset classes like equities, gold, and treasuries [1][17]. Pay attention to clustering, where LL/LH signals appear frequently over short intervals. Establish rules for trade frequency and capital allocation to prevent over-leveraging [1]. These steps help create a solid foundation for live monitoring and risk management.
Live Trading and Performance Monitoring
Once optimization is complete, live testing ensures the strategy performs effectively in real-world conditions. Transition from backtesting to live trading through a structured process: start with paper trading to validate your logic in real time, then move to a small live account to test for slippage and latency, and finally scale up as the system proves reliable [18].
Keep an eye on critical metrics such as slippage, fill rates, and average trade outcomes to identify discrepancies between live results and backtests [18]. A profit factor exceeding 1.2 with consistent distribution is often considered a baseline for automated strategies [18].
To manage risk, program automated safeguards that flatten all positions and block new entries if daily losses exceed a set threshold, such as 2R or a specific percentage of equity [18][5]. As MooreTechLLC aptly puts it:
"Automation is about turning repeatable edge into repeatable execution. If your idea cannot be written down as explicit, testable rules, it cannot be automated reliably" [18].
Review daily fills and P&L, compare weekly stats to backtest results, and perform monthly analyses [18]. Be mindful of market regime changes, such as volatility shifts or reduced liquidity during holidays, which can impact LL/LH pattern reliability [18]. Using high-performance VPS environments like those from TraderVPS, which boast 99.999% uptime, ensures your automated strategies run smoothly around the clock [16].
Maintaining and Updating LL and LH Systems
After live deployment, ongoing maintenance is vital to keep your LL/LH strategy aligned with changing markets. Use system health monitoring tools like heartbeat pings for your VPS, data feed checks, and broker API connectivity tracking to ensure uninterrupted operation [18]. Log any exceptions with timestamps and set up alerts for repeated issues, missed signals, or order rejections [18].
Incorporate walk-forward analysis, which involves optimizing on a rolling window (e.g., optimizing for six months and testing for two months), to see how your strategy adjusts to evolving market structures [18]. Maintain strict version control for all code and parameter changes, allowing you to revert to a previous version if live results deviate from backtests [18]. Before applying updates, run sensitivity analyses by varying parameters like EMA lengths or ATR multipliers to identify stable performance zones rather than short-lived spikes [18].
Your trading infrastructure is just as important as your strategy. TraderVPS offers 24/7 uptime and ultra-low latency execution near financial hubs like Chicago, ensuring your automated strategies remain responsive. Their plans include Windows Server 2022, NVMe storage, and unmetered bandwidth, with higher-tier options providing up to 24 cores and 64GB of RAM for demanding backtesting and optimization needs.
Consistently track key performance metrics such as average gain per trade, profit factor, and maximum drawdown [1]. Monitor slippage daily to catch any issues related to brokers or latency [18]. Remember, backtesting might not account for microstructure factors like queue priority, broker-specific order routing, and slippage [18].
Conclusion
Lower lows (LL) and lower highs (LH) are key elements in understanding market structures. They highlight when sellers dominate price movements and often indicate areas of institutional distribution [2][19]. For futures traders, these patterns are invaluable, offering clear levels for entries, exits, and stop-loss placements - whether you're trading manually or relying on automated systems. As Abdullah Shah explains:
"Lower Lows and Lower Highs are used to identify downtrend in the market. If trend is identified accurately, these patterns are used to identify opportunities during retracements and capitalize on the downward momentum" [2].
While LL/LH patterns are commonly associated with bearish trends, backtests - such as a 10-day holding period on the S&P 500 - show they can also signal short-term reversals [1]. This underscores the importance of thorough testing across multiple timeframes and markets.
For automated trading, detecting LL/LH patterns requires precise coding to identify inducement sweeps, confirm structures, and execute trades in milliseconds. This level of accuracy becomes even more critical during periods of high market volatility. TraderVPS steps in here with reliable infrastructure, offering 24/7 uptime and ultra-low latency to ensure your automated strategies perform without hiccups.
Their solutions are designed to meet diverse needs, ranging from the VPS Lite plan ($69/month, 4 cores/8GB RAM) for lighter workloads to Dedicated Servers ($299/month, 12+ cores/128GB RAM) for demanding tasks like intensive backtesting and real-time LL/LH pattern detection. With these tools, you can confidently manage both analysis and execution at peak efficiency.
FAQs
How do I use lower lows and lower highs to spot potential trend reversals?
To spot a possible trend reversal, keep an eye out for a steady pattern of lower lows and lower highs on the price chart, which typically signals a downtrend. A reversal might be on the horizon when this pattern changes - like the appearance of a higher low or higher high - indicating a potential shift in market direction.
Paying close attention to these changes can help you better plan your entry or exit points. Pairing this observation with tools like trendlines or momentum indicators can provide additional clarity and improve your market decisions.
How do lower lows and lower highs (LL/LH) impact automated trading systems?
Lower lows (LL) and lower highs (LH) are crucial signals in identifying a downtrend. They reflect growing selling pressure and a bearish market outlook. In automated trading systems, these patterns are often built into algorithms to guide actions like opening short positions, tightening stop-loss levels, or closing long positions once the LL/LH sequence is confirmed.
These patterns are straightforward to code with rules such as: current high < previous high and current low < previous low. This allows trading systems to determine trend direction, optimize entry and exit points, and enforce consistent risk management. For instance, placing a stop-loss just above the latest lower high can help limit potential losses.
By translating these visual patterns into code, traders can use them across different markets - whether it's futures, equities, or forex - while keeping their approach systematic and scalable. Pairing LL/LH patterns with other tools like moving averages or the RSI can further refine accuracy and enhance decision-making in automated strategies.
How can a VPS enhance the performance of lower-low and lower-high (LL/LH) trading strategies?
Using a VPS (Virtual Private Server) can take your lower-low and lower-high (LL/LH) trading strategies to the next level by offering faster and more dependable trade execution. With a VPS, your trading systems can run around the clock with minimal latency - an absolute must for strategies that depend on rapid responses to price changes.
Hosting your trading platform on a VPS helps eliminate delays caused by local internet disruptions or hardware issues, ensuring trades are executed at the intended price levels. Plus, a VPS provides a stable and secure setup, making it ideal for automated systems that analyze LL/LH patterns and execute trades in real-time based on those signals.


