
Key Indicators for Futures Trading
Futures trading relies on technical indicators to simplify complex market data, helping traders identify trends, momentum shifts, and key price levels. Tools like Moving Averages, RSI, Volume Profile, and Bollinger Bands provide actionable insights when combined effectively. Here's a quick breakdown:
- Moving Averages (SMA/EMA): Identify trends and dynamic support/resistance levels. Use shorter periods (e.g., 9 EMA) for day trading and longer ones (e.g., 200 SMA) for broader trends.
- RSI: Measures momentum on a 0-100 scale. Overbought (>70) or oversold (<30) levels can signal potential reversals.
- Volume Profile: Highlights price levels with significant trading activity, revealing support/resistance zones and market structure.
- Bollinger Bands: Assess volatility and potential breakouts or reversals. Narrow bands (squeezes) often precede big price moves.
Combining these indicators can refine strategies, but execution speed and reliability are critical. Using a VPS, like TraderVPS, ensures uninterrupted performance for indicator-heavy setups, offering low latency and consistent uptime for NinjaTrader platforms.
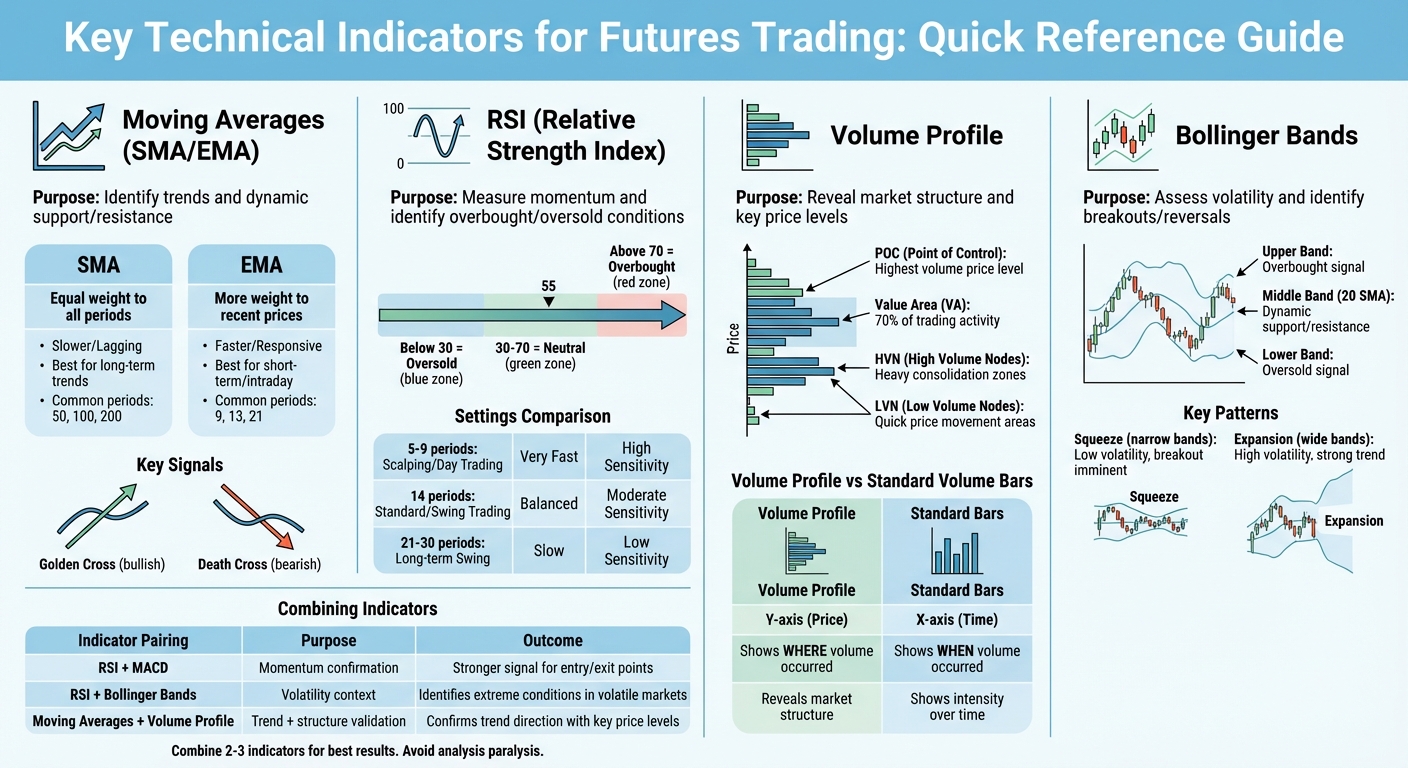
Key Technical Indicators for Futures Trading: Quick Reference Guide
Stop Using Indicators Wrong | The 3-Category System for Futures Trading Indicators
Moving Averages: Trend Identification and Crossover Strategies
Moving averages are a handy tool for smoothing out price fluctuations, making it easier to spot trends. The slope of the moving average tells you a lot: an upward-sloping line hints at bullish momentum, while a downward slope signals bearish conditions. As the NinjaTrader Team explains, moving averages help cut through noisy price action, making both short- and long-term trends clearer [2].
These averages also serve as dynamic support and resistance levels. In an uptrend, prices often "bounce" off the moving average, using it as support. In a downtrend, the moving average flips roles and acts as resistance. This dynamic quality makes moving averages practical for timing entries and exits without depending solely on fixed price levels. Now, let’s dive into the different types of moving averages and how to use them effectively.
SMA vs. EMA: Which One Fits Your Strategy?
The Simple Moving Average (SMA) gives equal weight to all data points in its calculation. This makes it slower to react, but it does a better job of filtering out random price spikes. On the other hand, the Exponential Moving Average (EMA) prioritizes recent prices, making it quicker to respond to market changes.
For day traders or scalpers, 9 and 21 EMAs are popular because they capture quick momentum shifts. Swing or position traders, however, often lean on 50 and 200 SMAs. These longer periods smooth out short-term noise and help identify broader trend reversals. SMAs also tend to align more closely with traditional support and resistance levels, as they are less affected by sudden price jumps.
| Feature | Simple Moving Average (SMA) | Exponential Moving Average (EMA) |
|---|---|---|
| Data Weighting | Equal weight to all periods | More weight to recent prices |
| Reaction Speed | Slower/Lagging | Faster/Responsive |
| Best Use Case | Long-term trend identification | Short-term/Intraday trading |
| Common Periods | 50, 100, 200 | 9, 13, 21 |
The choice between SMA and EMA can significantly impact your trade timing, especially when trading futures. By understanding their differences, you can fine-tune your strategy on NinjaTrader.
But moving averages aren’t just about smoothing trends - they also shine when it comes to crossover strategies.
Golden Cross and Death Cross Strategies
A Golden Cross happens when a shorter-term moving average rises above a longer-term one, signaling a potential bullish reversal. On the flip side, a Death Cross occurs when the short-term average dips below the long-term average, often signaling bearish momentum. These crossovers typically unfold in three stages:
- The preparation phase, where the moving averages begin to converge.
- The crossover itself, marking the signal for a potential trend change.
- The continuation phase, where the short-term average stays above or below the long-term line.
It’s worth noting that the Death Cross, often tied to market downturns, acts as a lagging indicator. Crossovers confirm trends rather than predict them, so it’s smart to pair these signals with additional evidence, like volume spikes. For instance, a Golden Cross backed by strong trading volume suggests solid market confidence. On the other hand, a crossover with weak volume might not hold up, making it less reliable for long-term decisions.
RSI: Momentum and Overbought/Oversold Levels
The Relative Strength Index (RSI) is a momentum indicator that operates on a scale from 0 to 100, using a standard 14-period average of gains and losses to measure price movement [6][5]. This scale makes it easier to identify overbought conditions (above 70) and oversold conditions (below 30), which are key for timing market entries and exits.
When RSI readings climb above 70, it signals overbought conditions, while readings below 30 suggest selling pressure might be easing [7]. According to Optimus Futures:
"The RSI measures the speed and size of price movement, indicating when prices may be overbought or oversold and potentially ready to stall or reverse" [6].
The 50-level is often seen as a midpoint. Readings above 50 indicate bullish momentum, while those below suggest a bearish trend [3].
However, during strong market trends, RSI may stay in overbought or oversold zones for extended periods. Waiting for the RSI to move back toward the neutral zone can provide confirmation of potential reversals [7]. Traders also adjust RSI settings based on their trading style - shorter periods (5–9) for scalping or day trading, and longer periods (21–30) for swing trading to filter out minor price fluctuations [8].
| RSI Setting | Trading Style | Response | Sensitivity |
|---|---|---|---|
| 5–9 Periods | Scalping / Day Trading | Very Fast | High |
| 14 Periods | Standard / Swing Trading | Balanced | Moderate |
| 21–30 Periods | Long-term Swing Trading | Slow | Low |
Using RSI for Trade Entry and Exit
RSI can be a powerful tool for identifying trade opportunities. For instance, entering trades when RSI moves back from extreme levels can confirm a reversal. A bullish divergence occurs when the price makes lower lows, but RSI forms higher lows, signaling a potential upward move [5][7][8]. Additionally, trendline breakouts on RSI often precede price breakouts, giving traders an early signal [8].
In strong uptrends, RSI might not dip as low as 30. Instead, it could pull back to the 40–50 range, with the 40 level acting as a support zone [6].
Reducing False Signals with RSI
To minimize false signals, pairing RSI with other indicators can provide confirmation. For example, combining RSI with MACD allows traders to validate momentum using two different calculation methods [9]. Similarly, when RSI shows an oversold reading and the price touches the lower Bollinger Band, the combined signals offer stronger insights into momentum and volatility [3].
Using multiple timeframes is another way to refine signals. A daily RSI signal becomes more reliable when supported by a rising monthly RSI [9]. MetroTrader emphasizes the importance of combining tools:
"RSI should be used with other tools like volume, support/resistance, or moving averages to confirm signals and reduce false positives" [7].
Another strategy involves watching for failure swings, where RSI breaks through its own internal support or resistance levels. These movements often provide more reliable signals than simply touching overbought or oversold levels [8].
| Indicator Pairing | Purpose | Key Signal |
|---|---|---|
| RSI + MACD | Momentum Confirmation | RSI oversold reading confirmed by MACD bullish crossover |
| RSI + Bollinger Bands | Volatility Context | RSI below 30 while price touches the lower Bollinger Band |
Volume Profile: Market Structure and Price Levels
While tools like Moving Averages and RSI help track trends and momentum, Volume Profile provides a deeper look into where market participants are actively committing capital. It offers a unique perspective on market structure by highlighting key price levels.
Volume Profile is essentially a horizontal histogram plotted along the y-axis, showing the total volume traded at specific price levels over a selected time frame [11]. Unlike the traditional volume bars that focus on when trades occurred, Volume Profile focuses on where trading activity was concentrated, making it an essential tool for understanding market dynamics.
Key Components of Volume Profile
- Point of Control (POC): This is the price level with the highest traded volume, often referred to as the "fair value." It acts as a magnet where market participants find alignment [4].
- Value Area (VA): Representing the price range where 70% of trading activity occurs, the VA reflects institutional traders' perception of fair value. This range typically aligns with one standard deviation from the POC [11].
-
High Volume Nodes (HVN): Peaks in the profile that indicate areas of heavy consolidation. As Adam from Jumpstart Trading puts it:
"High volume nodes act like gravity. They tend to attract price and try to hold it there" [11].
These zones slow down price movement due to prior consensus on value, much like the dynamic levels created by Moving Averages. - Low Volume Nodes (LVN): These are valleys, or "air pockets", where price tends to move quickly due to a lack of significant interest. Such zones often act as breakout points.
- Ledges: Sharp transitions between high and low volume create "shelves", which serve as advanced support and resistance levels. Markets trade within compression ranges 70% to 80% of the time, making these structural elements crucial for spotting potential reversals or pauses [10]. Unlike arbitrary technical levels, these zones are rooted in actual trading activity.
Volume Profile vs. Standard Volume Bars
To understand the added value of Volume Profile, it helps to compare it with standard volume bars. While standard bars show volume over time, they fail to reveal the specific price levels where trades occurred. Volume Profile, on the other hand, focuses on price-based volume distribution.
| Feature | Standard Volume Bars | Volume Profile |
|---|---|---|
| Axis | X-axis (Time) | Y-axis (Price) |
| Focus | When volume occurred | Where volume occurred |
| Market Insight | Intensity over time | Market structure and fair value |
| Support/Resistance | Not directly visible | Highlights key zones of capital commitment |
By understanding where volume has accumulated, traders gain insight into the price levels that institutional players consider important. Using continuous contracts ensures that volume data remains intact even as front-month contracts expire [10].
Combining Volume Profile with Price Action
When paired with price action, Volume Profile becomes even more powerful, helping traders refine their setups and confirm critical support and resistance areas. A cumulative profile covering 30 to 50 days can reveal major market structures and untested Points of Control (known as "naked POCs") from previous sessions. Meanwhile, session profiles are ideal for fine-tuning intraday strategies [10].
For example, after OPEC's unexpected production cuts in April 2023, crude oil futures surged to a Value Area High (VAH) of $77.00. As trading volume thinned, traders targeted the prior session's POC at $75.30 for a mean-reversion trade, where the price eventually stabilized [4]. This demonstrates how the POC can act as a profit-taking zone rather than an entry point, as prices often stall or "chop" in areas of high liquidity.
When prices break away from high-volume zones, waiting for a pullback to the HVN can provide solid support or resistance for continuation trades [11]. Additionally, placing trailing stops just behind emerging Points of Control offers better protection by leveraging high liquidity. If the market opens outside the previous day's Value Area and sustains that move, it typically signals a trend. However, if it reverts back into the Value Area, the opposite end becomes the next logical target [10].
Bollinger Bands: Volatility, Breakouts, and Mean Reversion
Bollinger Bands, built around a 20-period SMA with bands set at two standard deviations, are a popular tool for assessing market volatility [12]. As John Bollinger explains:
"Bollinger Bands are intended to answer one simple question: Are prices high or low on a relative basis?" [15]
The bands adjust dynamically, expanding during volatile periods and contracting when the market is calm. Typically, prices stay within these bands [16]. When prices hit the upper band, it often signals overbought conditions, hinting at potential profit-taking. Conversely, a touch at the lower band suggests oversold conditions and possible price rebounds [12]. However, in strong trends, prices may "walk" along the bands, maintaining momentum without a reversal.
The middle band, or the SMA, frequently acts as a dynamic support or resistance level. This feature makes it handy for setting stop-loss orders. For instance, if you enter a long position after an upper breakout, placing a stop-loss just below the middle SMA can help protect against sudden reversals [13]. When paired with other indicators, Bollinger Bands can provide more precise entry and exit points.
Reading Bollinger Band Squeezes and Expansions
When the bands narrow - known as a squeeze - it indicates low volatility and market compression. As the NinjaTrader team describes it:
"Consider [the volatility squeeze] as the calm before the storm" [12].
These squeezes often precede major price moves. A notable example occurred on September 18, 2019, when ES futures experienced a breakout following a Federal Reserve rate cut [14].
To trade squeezes, some traders place stop market or stop limit orders just outside the bands (e.g., $0.01 beyond) after observing repeated price rejections during the compression phase [15]. A true breakout is confirmed when the price closes outside the bands and continues to "walk" along them, rather than reversing immediately [15]. On the other hand, wide, expanding bands signal rising volatility and strengthening trends, which are ideal for trend-following strategies. To spot false breakouts, keep an eye on candles that close back inside the bands after touching them; this often indicates a failed breakout or trend exhaustion [1]. Additionally, if the bands flatten as the price approaches, it increases the chance of a brief breach followed by a reversal [16]. Bollinger Bands, much like Moving Averages and RSI, are a valuable addition to NinjaTrader strategies, offering clarity during volatile market conditions.
Using Bollinger Bands with RSI
Pairing Bollinger Bands with momentum indicators like RSI can make their signals even more reliable. For example, when the price touches the upper band and RSI exceeds 70, or when it hits the lower band with RSI below 30, these combined signals point to stronger reversal or bounce opportunities [13].
One practical case involved CBOT Corn (ZC) futures, where prices hit the lower Bollinger Band while RSI dropped below 20. This combination indicated a technical buy signal, filtering out false signals that might arise from using either indicator alone [13]. Another valuable insight comes from divergence. If the price makes a new high at the upper band but RSI fails to follow suit, this can signal weakening momentum and a potential mean reversion [17]. For mean reversion trades, traders often target the middle SMA as their first profit level, with the opposite outer band serving as the second target [14].
| Market Condition | Bollinger Band Signal | RSI Signal | Action/Interpretation |
|---|---|---|---|
| Overbought | Price touches/exceeds upper band | RSI > 70 | Potential sell/reversal |
| Oversold | Price touches/falls below lower band | RSI < 30 | Potential buy/reversal |
| Strong Trend | Price "walks" along the outer band | RSI > 50 (bullish) or < 50 (bearish) | Trend continuation; momentum persists |
| Weakening Trend | Price touches band | RSI divergence | Likely reversal |
| Consolidation | Bands are tight (squeeze) | RSI near 50 | Anticipate breakout |
It's important not to enter trades solely because the price touches a band. Waiting for a candle to close back inside the bands or for RSI to confirm momentum exhaustion can help you avoid being caught in false moves in volatile markets [17].
Building NinjaTrader Strategies with Multiple Indicators and TraderVPS
Using multiple indicators can give traders a clearer and more well-rounded view of the market. By combining different types of indicators, you can analyze various aspects of market behavior. For instance, pairing a trend indicator like Moving Averages with a momentum tool such as RSI and a volume-based indicator like Volume Profile helps confirm signals from multiple perspectives [6, 44, 45].
A practical approach might look like this: identify the trend using Moving Averages, wait for a pullback to a High Volume Node (HVN) on the Volume Profile, and use RSI (e.g., bullish divergence or crossing above 30) to time your entry [6, 9, 28]. This layered method filters out weak signals, increasing the odds of success.
For managing trades, the Volume Profile's Point of Control (POC) can act as a logical trailing stop level, as it aligns with areas of high trading activity [11]. Intraday traders can also apply the 80% Rule: if the price re-enters and holds within the prior session's value area for at least 30 minutes, there’s an 80% chance it will move to the value area’s opposite boundary [20]. These strategies highlight the importance of integrating reliable trading infrastructure to support indicator-heavy setups.
Matching Indicators to Your Trading Style
Choosing the right indicators for your trading style is just as important as the strategy itself. Scalpers, for example, benefit from fast-reacting tools like the 9 EMA or VWAP, while swing traders may find longer-term indicators such as the 50/200 SMAs or Ichimoku Clouds more effective [1, 6]. For trend-following strategies, combining Moving Averages with MACD and ADX works well - especially when the ADX is above 25, signaling a strong trend [1, 6]. On the other hand, reversal traders might pair RSI or Stochastics with Bollinger Bands to pinpoint potential exhaustion points [3].
A good rule of thumb is to stick to two or three key indicators. Overloading your charts with too many tools can lead to "analysis paralysis", where conflicting signals make decisions harder [6, 45]. As MetroTrade puts it:
"One indicator may confirm the signal of another... you get a clearer view of what the market is doing" [3].
For better accuracy, confirm short-term entry signals on a 5-minute chart, while keeping an eye on the broader trend using higher timeframes like the 60-minute or daily chart [1].
TraderVPS Plans for Running Indicator-Heavy Strategies
Running strategies with multiple indicators requires a reliable and powerful computing setup. NinjaTrader strategies that use tools like Volume Profile, Moving Averages, and RSI involve constant real-time calculations, which can overwhelm a standard home PC, especially if you’re monitoring several charts at once. That’s where TraderVPS comes in.
Here’s a breakdown of their plans:
- VPS Lite ($69/month): 4 AMD EPYC cores, 8GB DDR4 RAM - suitable for 1–2 charts and basic indicator setups.
- VPS Pro ($99/month): 6 cores, 16GB RAM, and 2-monitor support - ideal for 3–5 charts and more complex strategies.
- VPS Ultra ($199/month): 24 cores, 64GB RAM, and 4-monitor support - handles 5–7 charts for advanced traders.
- Dedicated Server ($299/month): 12+ AMD Ryzen cores, 128GB RAM, and 6-monitor support - designed for professional setups running 7+ charts.
All plans come with high-speed storage, solid security, and 99.999% uptime, ensuring uninterrupted trading [18]. Unlike trading on a home PC - which stops when your computer is off and can experience higher slippage due to slower execution - a professional VPS runs 24/7 and minimizes slippage with direct cross-connects [18]. For example, VPS environments in Chicago can achieve latencies as low as 0.52ms to the CME Group exchange, which can mean the difference between a filled order and a missed opportunity during volatile markets [18].
The multi-monitor support offered by these plans also lets traders efficiently monitor different indicators. For instance, you could track Volume Profile on one screen, follow price action with Bollinger Bands on another, and observe RSI momentum on a third - all while ensuring your strategies execute seamlessly, even during power outages or internet disruptions.
Conclusion
Technical indicators are invaluable tools for futures traders, helping to analyze trends, momentum, volatility, and volume. When applied thoughtfully - by aligning the right tools with market conditions and waiting for confirmation from price action - these indicators can cut through market noise and improve the timing of trades [3][7]. The secret lies in combining indicators from various categories to create confluence, where multiple signals come together to validate a potential trading opportunity [19].
However, even the most precise indicators won't deliver results without reliable execution. Futures markets move fast, and traders need infrastructure that keeps up. That’s where TraderVPS steps in, offering unmatched reliability with 99.999% uptime and ultra-low latency of less than 0.52ms to the CME Group exchange [18][21]. This means your NinjaTrader strategies stay active around the clock, ensuring seamless execution without interruptions.
Relying on local PCs can lead to unexpected shutdowns and increased slippage due to slower execution speeds [18]. TraderVPS eliminates these risks with powerful plans that include robust processing capabilities, multi-monitor support, and direct fiber connections. This setup minimizes slippage and ensures you can seize opportunities even in volatile markets.
Success in trading requires both sharp technical insights and dependable infrastructure. Whether you’re analyzing Volume Profile on one screen, tracking RSI divergence on another, or monitoring Bollinger Band squeezes across multiple timeframes, the right setup ensures your indicators consistently work in your favor. With markets spending 70% to 80% of their time in ranges [10], every millisecond and accurate signal matters. By combining precise technical tools with TraderVPS's reliable platform, futures traders can confidently capture opportunities, no matter how volatile the market gets.
FAQs
How do I decide between a Simple Moving Average (SMA) and an Exponential Moving Average (EMA) for futures trading?
When deciding between SMA (Simple Moving Average) and EMA (Exponential Moving Average), it all comes down to your trading approach, the market environment, and your specific goals. If you're leaning toward short-term trading or want quicker signals, the EMA is more responsive to recent price movements. On the flip side, for longer-term strategies or when you're trying to smooth out short-term fluctuations, the SMA offers a more stable view of trends.
In highly volatile markets, the EMA's sensitivity to price changes makes it a go-to for momentum-driven strategies. Meanwhile, the SMA excels at highlighting steady trends and pinpointing support or resistance levels. Many traders find value in using both - relying on the EMA for quicker signals and the SMA to validate trends. Testing these tools on historical data can help you figure out which fits best with your chosen futures contract and risk appetite.
At the end of the day, your decision should match your trading timeframe, strategy, and the current market dynamics. Keep an eye on performance and be ready to adjust as needed to fine-tune your results.
How does Volume Profile help identify important price levels in futures trading?
Volume Profile is a valuable tool that displays the total number of contracts traded at each price level. This allows traders to identify high-volume nodes, which often serve as important support or resistance levels. These zones highlight where significant trading activity has taken place, making them crucial areas to monitor for potential price reversals or periods of consolidation.
Using Volume Profile in your trading strategy gives you a clearer picture of market behavior. It visually maps out where buyers and sellers are most engaged, helping you fine-tune your entry and exit points in the futures market.
How can I use RSI with other indicators to improve my futures trading signals?
Combining the Relative Strength Index (RSI) with other tools can sharpen your trade signals and cut down on false entries. A common strategy is to pair RSI with the MACD. For instance, when RSI hits overbought (above 70) or oversold (below 30) levels, look at the MACD for confirmation - like the MACD line crossing above the signal line during an oversold RSI. This combination helps confirm momentum shifts and filters out short-term market noise.
For even greater accuracy, consider adding a trend-following indicator like a 20-period EMA or key volume-profile levels. A strong buy signal might occur when RSI climbs out of oversold territory, MACD shows a bullish crossover, and the price closes above the EMA or a key support level. On the flip side, a solid sell signal could involve RSI moving above 70, a bearish MACD crossover, and the price falling below the EMA or a resistance zone. By blending RSI with momentum and trend indicators, you can approach trading with more confidence and better risk control.


