
Candlesticks vs Footprints: Deep Market Reading
Want to understand market moves better? Candlestick charts show price trends, while footprint charts dive into trade volume at each price level. Here’s what you need to know:
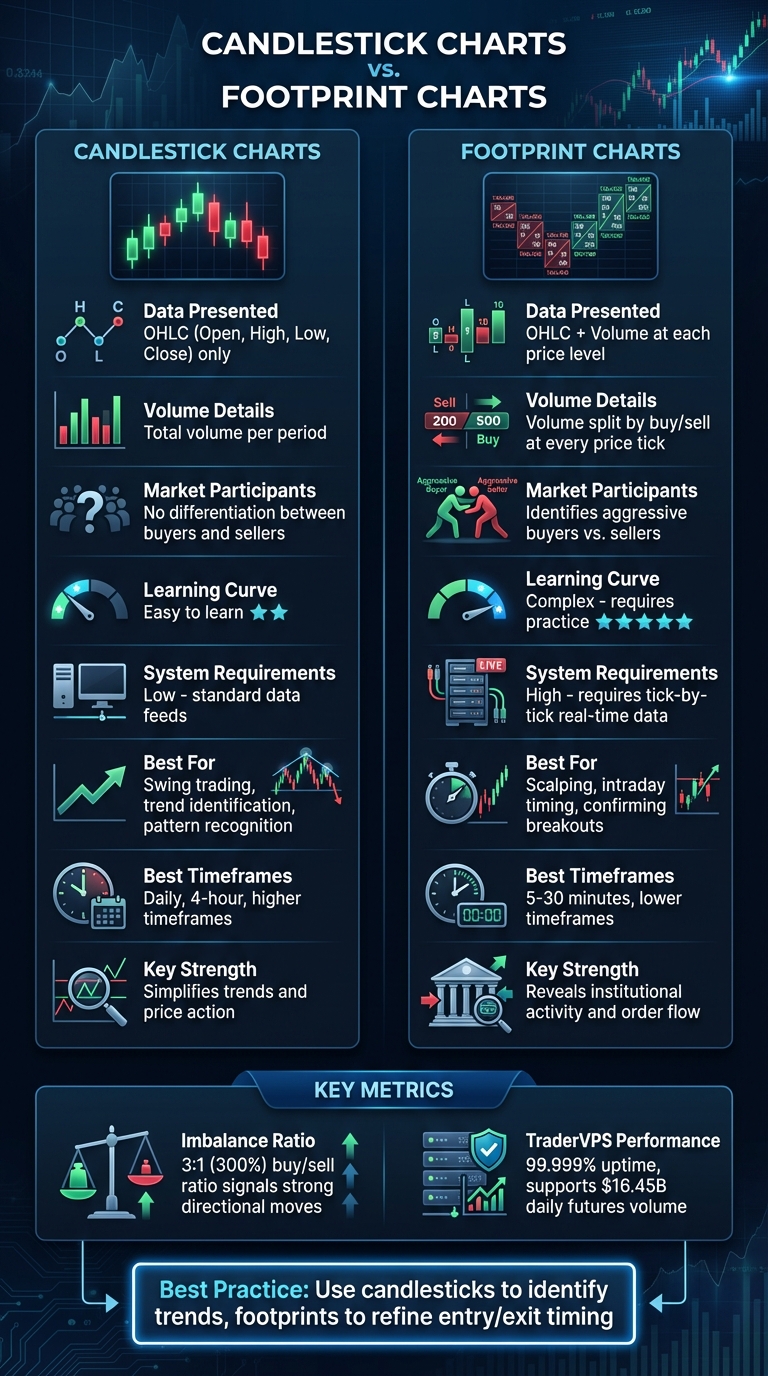
- Candlesticks: Focus on price action (Open, High, Low, Close). Great for spotting trends and patterns like hammers or engulfing candles. Best for swing traders and higher timeframes.
- Footprints: Reveal volume details (buy/sell activity, imbalances, absorption). Ideal for scalpers and day traders needing precise entry/exit points.
Key Differences:
- Candlesticks are simpler and good for trend analysis.
- Footprints provide deeper insights but require advanced tools and skills.
If you’re trading futures or volatile markets, combining both charts can give you a clearer edge. Candlesticks help map trends, while footprints refine timing. Tools like NinjaTrader and services like TraderVPS ensure smooth performance for data-heavy charts like footprints.
Quick Comparison:
| Feature | Candlestick Charts | Footprint Charts |
|---|---|---|
| Data | OHLC (price only) | OHLC + volume at each price |
| Volume Details | Total volume per period | Volume split by buy/sell |
| Learning Curve | Easy to learn | Complex, requires practice |
| Best For | Swing trading, patterns | Scalping, intraday precision |
| System Needs | Low | High (real-time tick data) |
Candlesticks simplify trends, while footprints uncover hidden market dynamics. Use both to align with your trading style and goals.
Candlestick vs Footprint Charts: Key Differences for Traders
Candlesticks vs Footprint
Candlestick Charts Explained
Candlestick charts date back to 18th-century Japan, where Munehisa Homma first used them to analyze market sentiment and price movements. Each candlestick represents a specific time frame - whether it’s 5 minutes, 1 hour, or 1 day - and captures four key data points: Open, High, Low, and Close (OHLC). This simple yet powerful structure provides a snapshot of price action, helps identify trends, and measures market momentum.
How Candlesticks Work
The real body of a candlestick represents the range between the opening and closing prices. A green or white body indicates that the price closed higher than it opened (bullish), while a red or black body shows that the price closed lower than it opened (bearish). The thin lines extending above and below the body, called wicks (or shadows), mark the highest and lowest prices reached during that time frame.
The length of the candlestick’s body reveals a lot about market dynamics. Long bodies suggest strong buying or selling pressure, showing that one side dominated the session. On the other hand, short bodies indicate a period of consolidation or indecision. Long wicks can signal that the market tested extreme price levels but reversed before the close. For example, a hammer - a candlestick with a small upper body and a long lower wick - often suggests a potential rebound after a price drop. A doji, where the opening and closing prices are nearly identical, indicates a balance between buyers and sellers.
Other patterns offer deeper insights into market sentiment. An engulfing candle, where the body of the second candle completely covers the first, signals a strong momentum shift. A shooting star, with a small body at the bottom and a long upper wick, shows that buyers pushed prices higher only to be overpowered by sellers. As Steve Nison, the expert who introduced candlestick charting to the Western world, explains:
The 'what' (price action) is more important than the 'why' (news, earnings, and so on). [6]
What Candlestick Charts Do Well
Candlestick charts are excellent at identifying trends. Long bullish candles generally signal an uptrend, while long bearish candles point to a downtrend. They’re also useful for spotting support and resistance levels - key price zones where buying or selling pressure tends to dominate. This helps traders determine entry and exit points with greater confidence.
Recognizing patterns is crucial. Formations like the Morning Star or Marubozu can indicate reversals, continuations, or periods of indecision. For instance, during the 2020 market crash, Apple Inc. (AAPL) formed a hammer candlestick on its daily chart. Traders who recognized the pattern were able to enter long positions and benefit from the subsequent rally [10].
In futures markets, candlestick charts are often paired with data like volume and open interest - the total number of active contracts - to assess the strength behind price movements [7].
That said, candlestick charts do have their limitations.
What Candlesticks Don't Show
While candlesticks provide a clear visual of price action, they don’t include internal market data such as volume, bid/ask spreads, or order flow [8][9]. As StockCharts.com points out:
Candlesticks don't reflect the sequence of events between the open and close. They only reflect the relationship between the open and close. [6]
This means they don’t show the order in which price extremes occurred or how much volume was traded at each level. In volatile or low-volume markets, this lack of detail can lead to misleading signals. For example, a bullish candlestick might suggest strong buying, but without volume data, there’s no way to confirm whether the move was driven by significant market activity or just a few trades.
This gap in information highlights the value of other tools, such as footprint charts, which provide a deeper look into order flow and trading activity.
Footprint Charts Explained
Candlestick charts are great for showing price movements, but they don’t tell the whole story. That’s where footprint charts come in. These charts dig deeper, showing the exact volume of trades at each price level within a single candle [2]. Think of them as a magnifying glass for market activity, revealing the order flow that candlesticks often hide.
Footprint charts, also known as cluster charts, break down each candlestick to display volume distribution at every price tick. They help you see who’s in control - buyers or sellers - by highlighting their activity [1]. This level of detail relies on real-time tick data (Level 2 data) to capture every transaction accurately [1]. Without this data, footprint charts can’t display the critical bid/ask activity that makes them so insightful. That’s why traders who rely on footprint charts need a fast, reliable connection - something TraderVPS specializes in for platforms like NinjaTrader.
Let’s dive into the key components that make footprint charts so effective.
How Footprint Charts Work
Footprint charts organize data into essential elements that reveal market behavior. At their core is the bid/ask volume, shown as numbers within each price level of a candle.
- Delta: This is the difference between buying and selling volume at a specific price level [1]. A positive delta means buyers dominated that level, while a negative delta shows sellers were in control. For beginners, starting with a Delta Footprint simplifies the data by focusing on a single net column instead of separate bid/ask figures.
- Point of Control (POC): This marks the price level within a candle where the most trading volume occurred. It represents the "fairest" price, where buyers and sellers found the most agreement [1]. The POC can act as a magnet, often pulling prices back to these high-volume zones.
- Volume Imbalances: These occur when one side of the market outweighs the other by a significant margin, typically at least 3-to-1 (300%) [1]. Imbalances indicate institutional activity and often signal strong directional moves. When imbalances stack up in the same direction across consecutive price levels, it confirms sustained buying or selling pressure [1].
These components work together to provide a clearer picture of market dynamics and help traders interpret price action more effectively.
What Footprint Charts Do Well
Footprint charts shine when it comes to identifying absorption. This happens when high trading volume occurs at a specific price level without much price movement. It’s a sign that large limit orders are absorbing aggressive market orders, often indicating institutional activity at key support or resistance levels [1]. Absorption frequently precedes reversals, as late traders are forced to adjust their positions.
Another valuable signal is delta divergence. This occurs when the price reaches a new high or low, but the delta doesn’t confirm the move. It suggests a lack of conviction and potential exhaustion, giving traders an early warning of a possible reversal [1].
Footprint charts also highlight incomplete auctions, which are price extremes where volume doesn’t taper off to zero. This suggests that the market hasn’t fully explored that level yet and may revisit it in the future [2].
As the Chart Champions Team puts it:
The real strength of footprint charts is revealing what happens inside each candle, highlighting where buyers and sellers are positioned.
For scalpers and day traders, the precision of footprint charts is invaluable. They provide the micro-level timing needed to catch quick price movements. By showing exactly when aggressive participants enter the market, these charts make it easier to time entries and exits effectively [1].
Challenges with Footprint Charts
Despite their benefits, footprint charts come with a steep learning curve. Interpreting the bid volume, ask volume, delta, imbalances, and POC within a single candle can be overwhelming for new users [1]. Mastery takes time and practice.
These charts are also highly data-intensive. They require real-time tick feeds to function properly, as delayed data lacks the detail needed for accurate analysis [1]. This often means traders need to invest in premium data subscriptions and robust technical setups.
Another challenge is that footprint data can "repaint" in real time. For instance, historical data may be recalculated using less granular intervals, such as shifting from 1-tick to 1-second data [5]. This can create confusion when reviewing past trades or backtesting strategies.
Finally, stable, low-latency hosting is essential for using footprint charts during high-volatility periods. Even slight delays can result in missed opportunities or inaccurate readings. TraderVPS tackles this issue with infrastructure capable of supporting over $16.45 billion in daily futures volume and 99.999% uptime [3]. This ensures your data remains accurate when it matters most, giving you the edge in fast-moving markets.
Candlesticks vs Footprints: Direct Comparison
Candlestick charts illustrate price movement, while footprint charts go deeper by showing the volume details behind those movements. Candlesticks provide four key price points for each period - open, high, low, and close (OHLC). In contrast, footprint charts build on this by adding volume distribution at each price level, highlighting order flow dynamics like absorption and imbalances [2][1][4]. They categorize volume into "buy" (lifting the offer) and "sell" (hitting the bid), with these figures typically shown on the right and left sides of the bar, respectively [2][11].
Feature Comparison Table
| Feature | Candlestick Charts | Footprint Charts |
|---|---|---|
| Data Presented | OHLC only | OHLC + Volume at each price level |
| Volume Data | Total volume per period (usually below chart) | Volume distributed across each price level within the bar |
| Market Participants | No differentiation between buyers and sellers | Identifies aggressive buyers vs. aggressive sellers |
| Learning Curve | Low; standard for all traders | High; requires understanding of order flow |
| System Requirements | Low; standard data feeds | High; requires high-quality, tick-by-tick data |
| Best Use Case | Trend identification, swing trading | Scalping, intraday timing, confirming breakouts |
This table highlights where each tool shines. Now, let’s look at when to use candlesticks versus footprints.
Best Uses for Candlesticks
Candlesticks are ideal for traders analyzing higher timeframes or aiming to capture the market's bigger picture. Swing traders - those holding positions for days or weeks - benefit most from candlesticks, as they excel at identifying trends and patterns. Classic formations like engulfing candles or harami patterns are particularly useful for spotting potential reversals on daily or weekly charts.
Another advantage? They’re simple to use. Candlesticks don’t demand premium data feeds or complex software. A standard charting platform is enough, making them perfect for traders who want a straightforward, low-maintenance approach to analyzing trends and patterns.
Best Uses for Footprints
Footprint charts, on the other hand, are designed for scalpers and intraday traders who need precise timing. When holding positions for just minutes or hours, knowing exactly where aggressive buyers or sellers are stepping in can make or break a trade. As Kyle Maring from HighStrike explains:
Footprint charts provide an advantage of knowing what the large players are doing in the market. [4]
Footprints are particularly useful at critical price levels - like major support, resistance, or breakout zones - where it’s vital to confirm whether institutional players are entering or exiting. For example, in high-volatility futures markets like the E-Mini S&P 500, footprint charts can reveal market imbalances (often with at least a 3-to-1 ratio) and absorption patterns that signal potential reversals [1][5].
While footprint charts require more expertise, better data, and more advanced systems, they’re invaluable for traders who need to see beyond the surface of a candlestick. If your trading strategy demands precision and a deeper understanding of what drives price movements, footprint charts are worth the investment. Tailoring your NinjaTrader workspace to include these tools can help align your analysis with the unique demands of your trading style.
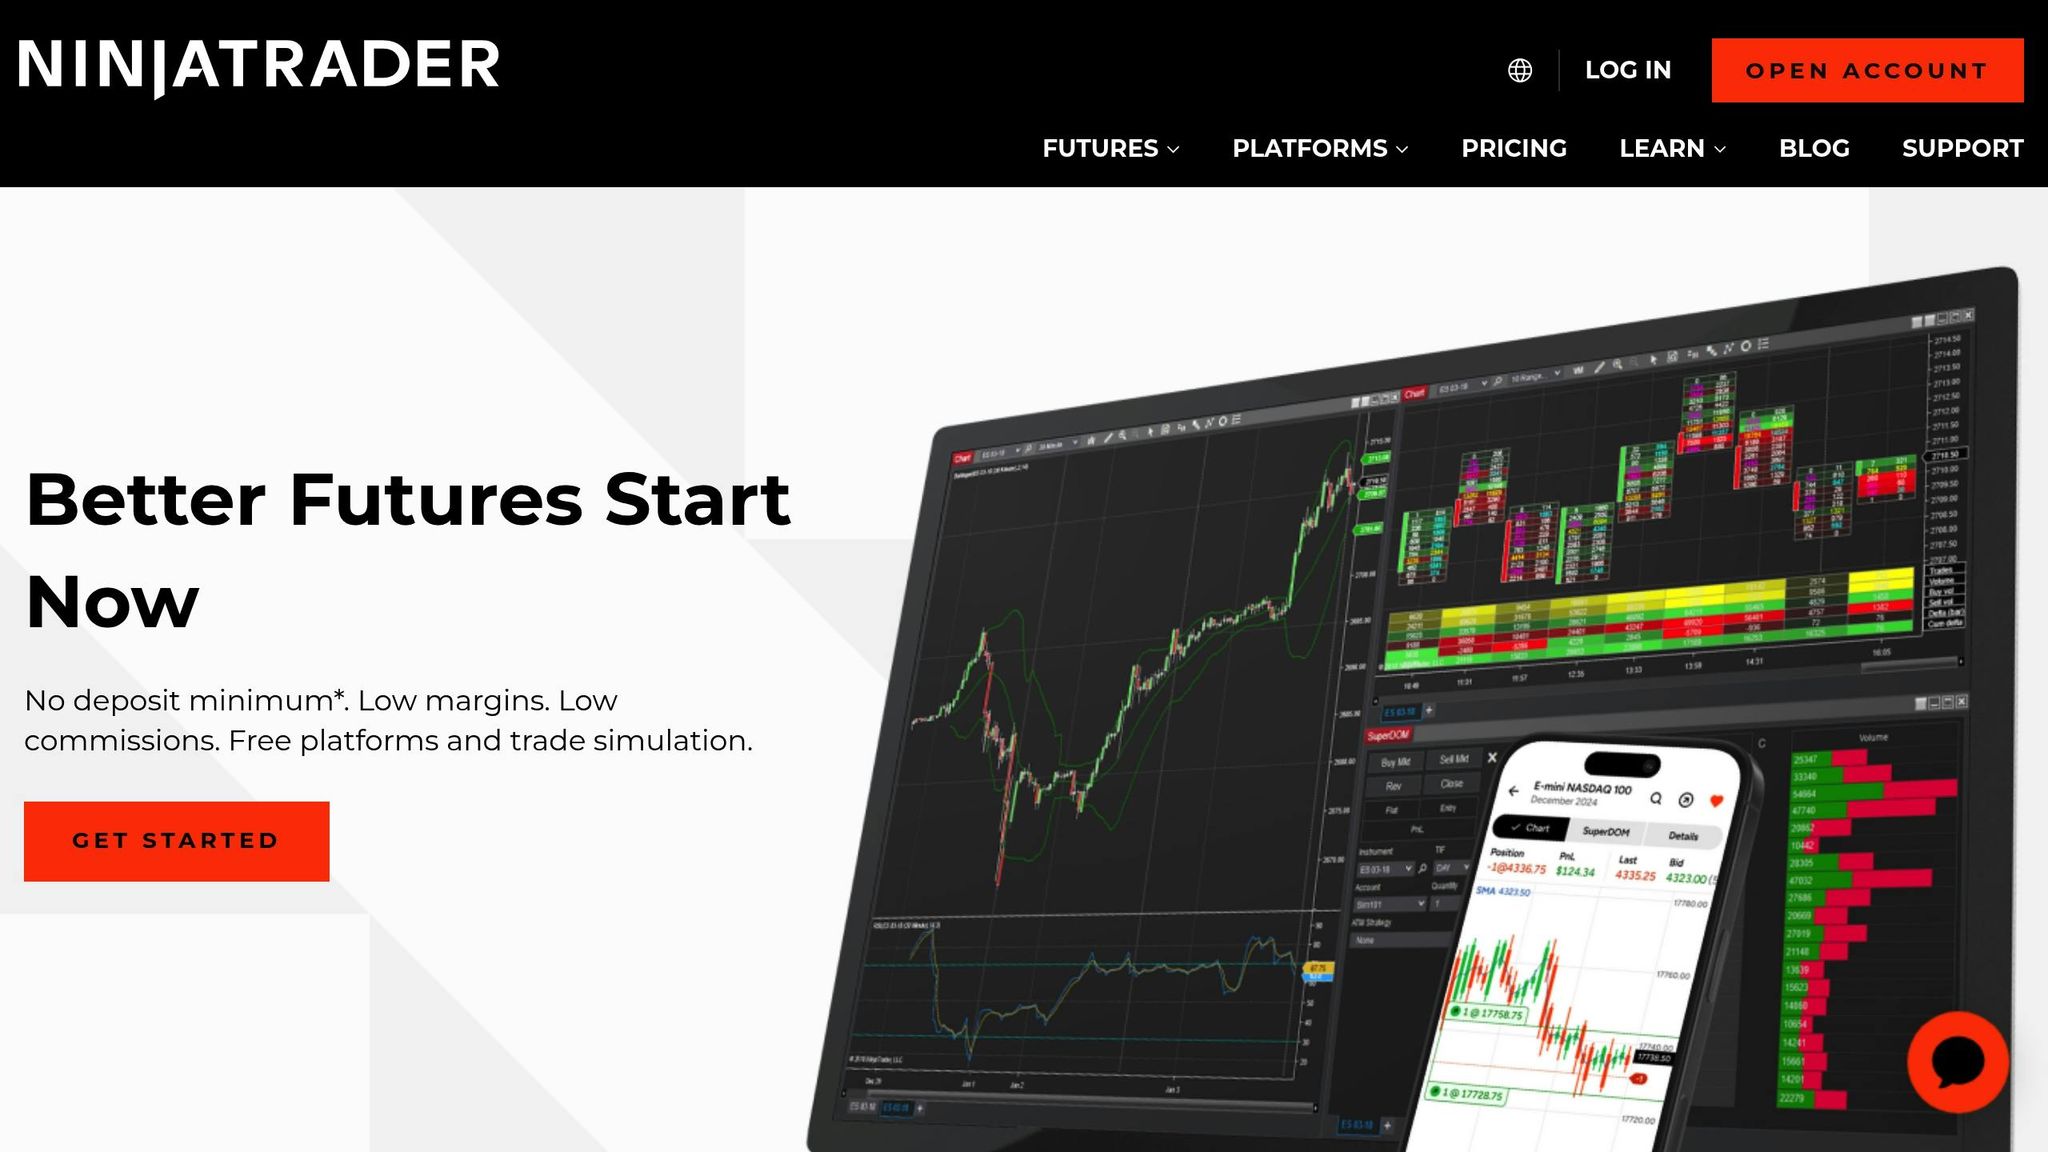
Running Charts on NinjaTrader with TraderVPS
System Requirements and Performance
Footprint charts demand significantly more computing power than traditional candlestick charts. This is because they process every tick and aggregate volume at each price level, requiring your system to handle a much larger data load in real time.
TraderVPS is designed to manage this workload with infrastructure tailored specifically for trading platforms. Their service boasts 99.999% uptime and low-latency connections to key exchanges like the CME in Chicago, ensuring trades execute smoothly without the lag that can derail scalping strategies [3]. For most traders, the VPS Pro package - featuring 6 AMD EPYC cores, 16GB RAM, and support for up to 3–5 charts - offers ample performance. For those with higher demands, the VPS Ultra package provides 24 cores and 64GB RAM, delivering seamless operation even in high-volatility conditions.
This level of reliability allows you to focus on setting up your workspace and executing strategies in NinjaTrader without worrying about performance hiccups.
Setting Up NinjaTrader Workspaces
Once performance is locked in, the next step is configuring your NinjaTrader workspaces. A good approach is to create two separate workspaces: one for candlestick charts and another for footprint charts. Use the candlestick workspace, set to higher timeframes (like daily or 4-hour), to identify trends. Meanwhile, the footprint workspace, set to lower timeframes (5–30 minutes), helps you refine your trade execution.
Synchronization is key. For example, if you're using 30-minute candlesticks to analyze trends, your footprint chart should also aggregate data into 30-minute intervals [2]. This ensures that the order flow data on your footprint chart aligns perfectly with the price action on your candlestick chart. Additionally, link both workspaces to the same instrument so that switching between assets - like moving from ES to NQ - updates all charts simultaneously.
Preventing Information Overload
Start simple by focusing on Delta, which reflects the net buying versus selling volume [1]. Once you’re comfortable interpreting Delta, gradually introduce other metrics like Point of Control (POC), Value Area, and stacked imbalances.
Adjusting the "Ticks per Row" setting can help balance detail and clarity. A common default for identifying imbalances is 300%, meaning one side’s volume must be three times larger than the other [5]. Use manual row sizing to ensure your charts maintain consistency between live trading and historical analysis [5]. Additionally, apply a uniform color scheme - such as green for buying and red for selling - across all charts. This consistency speeds up pattern recognition, which is crucial when every second matters [1].
Conclusion
Candlestick and footprint charts serve as two sides of the same coin: candlesticks provide a broad view of price movement, while footprints dig into the volume and trading aggression driving each tick of action [1]. When used together, these tools offer a level of market insight that neither can achieve on its own.
The choice between these charts depends largely on your trading approach. If you're a swing trader tracking longer-term trends, candlesticks will likely be your go-to tool. On the other hand, if you're a scalper trading ES futures or navigating volatile sessions, footprint charts are invaluable for revealing real-time institutional activity and order flow imbalances [1]. Many traders find success by using candlesticks to identify trends and zones while relying on footprints for precise entry and exit points.
"Footprint analysis should supplement - NOT supplant - your current techniques by allowing you a more in-depth understanding of the demand and supply forces acting below the price action." - TradeThePool [1]
The technical requirements for running these charts, particularly footprint charts with their tick-by-tick data processing, demand robust infrastructure. TraderVPS guarantees reliable performance with 99.999% uptime and low-latency connections [3]. Whether you're working with candlestick setups or data-heavy footprint charts, this platform ensures your tools stay responsive during critical market moments.
Begin with the chart type that fits your current skill set and trading goals. As you grow more experienced, integrate the other to enhance your market analysis and refine your edge. By aligning your charting tools with your trading style, you can unlock the full potential of both candlesticks and footprints.
FAQs
What makes footprint charts more effective than candlestick charts for analyzing market behavior?
Footprint charts give traders a closer look at market activity by showing trade volume, order flow, and bid/ask data right on the chart. This setup lets traders observe the interaction between buyers and sellers, spot imbalances, and get a clear read on market sentiment.
While candlestick charts focus on summarizing price movements, footprint charts dig into the why behind those moves. They help traders confirm trends, detect possible reversals, and assess liquidity levels - offering a powerful way to dive deeper into market behavior.
How can I use candlestick and footprint charts together for better trading decisions?
To make the most of candlestick charts and footprint charts, it’s essential to align them on the same timeframe. This ensures the data you’re analyzing is consistent and comparable. Candlestick charts are great for capturing the bigger picture - showing price trends and overall market sentiment. On the other hand, footprint charts dive deeper, offering a closer look at order flow, volume distribution, and the activity of buyers and sellers at specific price points.
When used together, these tools provide a comprehensive market perspective. This can be especially useful in futures trading, where precise entry and exit decisions are critical. By combining the broader trends from candlestick charts with the detailed insights from footprint charts, you can spot trading opportunities more clearly and manage risks with greater confidence.
What do I need to effectively use footprint charts for market analysis?
To make the most of footprint charts, you’ll need a few essentials: Level 2 trade data access, real-time executed trade data, and a charting platform capable of displaying footprint or cluster charts. These tools are key to examining market activity with accuracy.
Start by selecting the right type of footprint chart for your needs - whether it’s bid/ask, volume, or delta. Then, align the data granularity with your trading approach, such as using tick-based or time-based intervals. Features like imbalance detection and delta calculations can further enhance your understanding of order flow and market trends.


