
Bollinger Bands Mastery: Essential Trader Handbook
Bollinger Bands are a key tool for traders, designed to adapt to market volatility. Created by John Bollinger in the 1980s, these bands consist of a 20-period moving average and two lines set two standard deviations above and below it. They help identify high and low price levels, making them valuable for analyzing trends, reversals, and periods of low volatility.
Key takeaways:
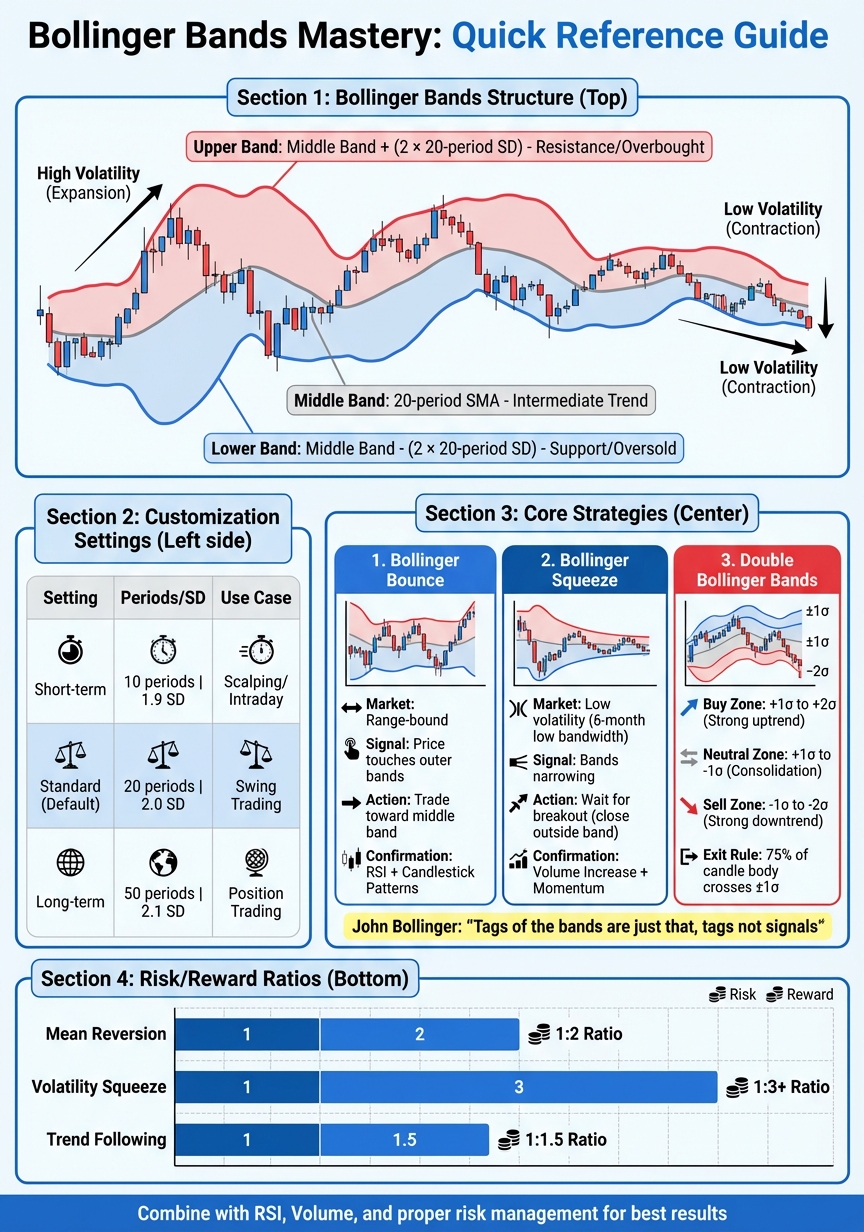
- Structure: A middle band (20-period SMA) and two outer bands (±2 standard deviations).
- Purpose: Measure volatility and provide a relative definition of price highs and lows.
- Use Cases: Spotting squeezes, breakouts, and trend strength in futures trading.
- Strategies: Combine with tools like RSI or volume indicators for confirmation.
Bollinger Bands are not standalone buy/sell signals but a way to interpret price movement with context. They’re especially useful for futures markets, where quick decision-making is critical.
Bollinger Bands Settings and Strategies Comparison Chart
How to Use Bollinger Bands | Identifying Market Environments (Part 1)
How Bollinger Bands Work
Building on their design, let's dive into how Bollinger Bands are calculated and how their settings can be tailored for effective futures trading.
Bollinger Bands Formula and Calculation
The math behind Bollinger Bands is simple yet impactful. The middle band is a 20-period simple moving average (SMA) of closing prices. The upper band is created by adding two times the 20-period standard deviation to the middle band, while the lower band subtracts the same multiple. This use of standard deviation ensures the bands adjust dynamically to market volatility. When markets are more volatile, the bands expand. When volatility decreases, they contract.
Each part of the bands serves a purpose:
- The middle band reflects the intermediate-term trend.
- The upper band often signals overbought levels, acting as potential resistance.
- The lower band points to oversold levels, serving as potential support.
| Component | Formula | Trading Insight |
|---|---|---|
| Middle Band | 20-period SMA | Represents the intermediate trend |
| Upper Band | Middle Band + (2 × 20-period SD) | Indicates statistically high levels; potential resistance |
| Lower Band | Middle Band - (2 × 20-period SD) | Indicates statistically low levels; potential support |
Default Settings and Customization
The standard Bollinger Bands setup uses a 20-period SMA with bands set at two standard deviations. This configuration, established by John Bollinger, captures intermediate trends effectively while accounting for price movements.
However, Bollinger himself highlights the importance of adaptability:
"The default parameters of 20 periods for the moving average and standard deviation calculations, and two standard deviations for the width of the bands are just that, defaults. The actual parameters needed for any given market/task may be different." - John Bollinger, CFA, CMT
Traders can tweak these settings to suit different market conditions. For instance:
- A longer moving average, such as 50 periods, might pair well with a 2.1 standard deviation to better capture broader trends.
- A shorter moving average, like 10 periods, could use a 1.9 standard deviation to stay responsive to short-term movements.
| Setting Type | Period (N) | Std. Deviation (K) | Typical Use Case |
|---|---|---|---|
| Short-term | 10 | 1.9 | Scalping or high-sensitivity intraday trading |
| Standard | 20 | 2.0 | Swing trading and intermediate trends (default) |
| Long-term | 50 | 2.1 | Position trading and daily/weekly trend analysis |
Shorter periods with tighter bands (e.g., 1.5 standard deviations) can produce more signals but may also increase false positives. On the other hand, longer periods with wider bands (e.g., 3 standard deviations) help reduce noise but may lag behind quick price changes. Some traders even layer multiple bands - such as one at 1 SD and another at 2 SD - to better understand volatility zones and spot buy or sell opportunities.
If you decide to use an exponential moving average (EMA) for the middle band, make sure to apply it consistently for both the central line and the standard deviation.
Setting Up Bollinger Bands on NinjaTrader
NinjaTrader makes it easy to use Bollinger Bands, as they are built into the platform as a standard indicator. The Market Analyzer tool allows you to track Bollinger Band values across multiple futures contracts simultaneously. This makes it simple to identify squeezes or overbought/oversold conditions without needing to flip through individual charts.
For seamless performance, services like TraderVPS ensure your Bollinger Bands remain updated in real time, even during volatile market spikes. With features like NVMe storage and AMD EPYC cores, TraderVPS ensures your charts stay responsive when every millisecond matters.
If you're new to Bollinger Bands, NinjaTrader's simulated trading environment is a great place to start. You can test different settings and observe how the bands behave under various market conditions before risking real money.
Core Bollinger Bands Strategies
Bollinger Bands offer a versatile approach to trading, and the strategies below demonstrate how to turn this technical tool into actionable setups.
Bollinger Bounce and Breakout Strategies
The Bollinger Bounce focuses on price reversals in range-bound markets. When the price touches the upper or lower band, it often gravitates back toward the middle band. This happens because extreme price movements, while possible, tend to reverse more often than not.
That said, as John Bollinger himself cautions:
"Tags of the bands are just that, tags not signals."
In strong trends, prices can "walk the band", meaning they may continue moving along the upper or lower band instead of reversing. Blindly trading against these moves can lead to losses.
For a long bounce, look for signals like a recovering RSI (rising from 30 to 50) and a bullish reversal candlestick patterns. For a short bounce, watch for a declining RSI (falling from 50 to 70) and bearish patterns. Use the middle band as the first profit target, with the opposite band as the final goal.
The breakout strategy takes an entirely different approach. When the bands widen after a period of contraction, it often signals the beginning of a new trend. In this case, trade in the direction of the breakout. Volume plays a key role here - rising volume during the breakout is a strong indicator of market conviction [4].
| Action | Market Condition | Signal/Indication |
|---|---|---|
| Price touches lower band | Ranging/Sideways | Potential Buy (Oversold) |
| Price touches upper band | Ranging/Sideways | Potential Sell (Overbought) |
| Price "Walks" the Band | Strong Trend | Trend Continuation (Avoid Fading) |
| Price crosses Middle Band | Post-Bounce | Confirmation of Reversal to Opposite Band |
Bollinger Squeeze Setup
The Bollinger Squeeze strategy identifies periods of low volatility, where the bands narrow significantly, setting the stage for a potential breakout. This setup is based on a fundamental trading principle:
"Periods of low volatility are often followed by periods of high volatility."
A Squeeze occurs when the BandWidth reaches its lowest level in six months [6]. Another method, called the TTM Squeeze, identifies a Squeeze when Bollinger Bands (20-period, 2 standard deviations) fit entirely within the Keltner Channels (20-period, 1.5 ATR) [8]. This comparison of standard deviation and Average True Range offers a nuanced view of market conditions.
Since the Squeeze doesn’t indicate the direction of the breakout, combining it with momentum indicators like RSI or volume-based tools such as On-Balance Volume (OBV) can provide clarity. Wait for a candle to close outside either the upper or lower band before entering a trade - this confirms the breakout [7][8].
Be cautious of false breakouts, where the price briefly breaks one band only to reverse sharply and break the opposite band. To manage this risk, set stop-losses on the side opposite the consolidation area [4].
| Squeeze Component | Technical Condition | Trader Action |
|---|---|---|
| Identification | Bands reach 6-month low width | Monitor for an impending breakout |
| Bullish Breakout | Price closes above the Upper Band | Enter a long position |
| Bearish Breakout | Price closes below the Lower Band | Enter a short position |
| Directional Filter | Positive divergence in RSI/OBV | Bias toward an upside breakout |
| Risk Management | Price reverses back into the range | Exit trade to avoid false breakout |
Double Bollinger Bands for Volatility Zones
Double Bollinger Bands (DBB) provide a more detailed view of price action by plotting two sets of bands: one at one standard deviation (1σ) and another at two standard deviations (2σ) [4]. Both sets use the same 20-period simple moving average, creating zones that highlight the market's strength and direction.
- The Buy Zone (between +1σ and +2σ) signals a strong uptrend. Price holding in this range reflects sustained bullish momentum, making it a good area for trend traders to hold long positions [4].
- The Sell Zone (between -1σ and -2σ) indicates a strong downtrend, ideal for short positions [4].
- The Neutral Zone (between +1σ and -1σ) is typically avoided for trend-following trades due to its lack of clear direction [4].
The 75% rule helps with exits: for a long position, exit when a red candlestick closes with more than 75% of its body below the +1σ line. For reversal traders, calculate the width of the neutral zone and add that distance to the outer band to set a stop-loss. This method accounts for market volatility [4].
| Volatility Zone | Band Range | Market Sentiment | Trader Action |
|---|---|---|---|
| Buy Zone | +1σ to +2σ | Strong Uptrend | Enter/Hold Long |
| Neutral Zone | +1σ to -1σ | Consolidation / No Trend | Wait / Neutral |
| Sell Zone | -1σ to -2σ | Strong Downtrend | Enter/Hold Short |
| Overextended (High) | Above +2σ | Potential Overbought | Watch for Reversal |
| Overextended (Low) | Below -2σ | Potential Oversold | Watch for Reversal |
For futures traders, start with daily or weekly charts to understand the broader market context. Then, use shorter timeframes - like 10-minute or hourly charts - to pinpoint entries and exits as the price transitions between zones [5]. Combining DBB with volume indicators or momentum tools like RSI ensures that moves into these zones are supported by genuine market strength [5].
Advanced Techniques with Bollinger Bands
Combining Bollinger Bands with Moving Averages
One effective strategy is combining Bollinger Bands with a short-term moving average (commonly referred to as the BBMA strategy) to reduce market noise. For instance, pairing a 5-day moving average (MA) with a 20-day Bollinger Band can help identify precise entry signals. In this setup, an upward-sloping 20-period simple moving average (SMA) indicates a bullish trend. A buy signal might appear when the 5-day MA crosses above the +1σ band, while a sell signal could occur when it crosses below the -1σ band [13, 19].
For traders who prefer a longer-term perspective, extending the middle band to a 50-period average is an option. However, John Bollinger advises adjusting the standard deviation from 2.0 to 2.1 in such cases to maintain consistency in capturing price movements [3]. As Bollinger himself explained:
"The average deployed as the middle Bollinger Band should not be the best one for crossovers. Rather, it should be descriptive of the intermediate-term trend."
To manage risk, consider placing a stop-loss at the 20-period MA and setting profit targets at the ±2σ bands [3]. For traders relying on multi-timeframe analysis, tools like TraderVPS can provide low-latency execution to enhance precision.
Another advanced approach involves incorporating momentum indicators to further validate signals.
Using RSI with Bollinger Bands
Adding another layer of confirmation to your Bollinger Bands strategy can significantly improve trade accuracy. Pairing the Relative Strength Index (RSI) with Bollinger Bands is particularly useful for mean reversion trades. In this method, look for price touches on the outer bands combined with extreme RSI readings. For example, an overbought condition is flagged when the price touches the upper band and the RSI exceeds 70, while an oversold condition is identified when the price touches the lower band and the RSI falls below 30 [20, 21]. This combination helps address the common issue of "band walking" in strong trends, with RSI acting as a momentum filter to determine whether a move is truly exhausted or merely pausing [5, 6].
Take Yahoo! shares in December 2006 as an example: the price briefly dipped below the lower band but rebounded after RSI confirmed a reversal during a retest [10]. In contrast, IBM's February 2007 performance showed the risks of ignoring RSI confirmation when the price closed below the lower band and continued to decline [10].
Backtesting this strategy on SPY from 2018 to 2023 revealed a 63.5% win rate and a profit factor of 1.68 [9]. In mean reversion trades, the middle Bollinger Band often serves as the primary profit target, while the opposing outer band can act as a secondary target [18, 21]. For stop-loss placement, you might set it approximately 10 pips beyond the high or low of the signal candle or use a volatility-based stop like 1.5× the Average True Range (ATR) [18, 21].
For those running backtests across multiple instruments and timeframes, using a reliable platform like TraderVPS ensures your algorithms can process and respond to every critical market signal with stability and speed.
Risk Management and Common Mistakes
Managing risk effectively is the foundation for success when trading with Bollinger Bands.
Stop-Loss Placement and Position Sizing
Smart stop-loss placement is essential when using Bollinger Bands. For breakout or squeeze strategies, place your stop-loss just outside the consolidation zone, on the side opposite the breakout. This helps protect against failed breakouts and limits potential losses [4].
Another approach is to use volatility-adjusted stops. Measure the distance between the +1 and -1 standard deviation bands, then add that value to the outer band. This method accounts for the market's current volatility, avoiding arbitrary stop levels [4].
For trend-following trades, consider using the 20-day SMA as a trailing stop. If the price closes below this level in an uptrend, it might be time to exit [2]. Alternatively, apply the 75% rule: if a candle closes with more than 75% of its body outside the trend zone, either exit or tighten your stop [4].
When determining position sizes, the BandWidth indicator is a valuable tool. Narrower bands indicate lower risk per share but may also signal the potential for a sharp breakout. Adjust your position size accordingly [5] [1]. No matter the setup, always set a hard limit for losses - such as 10% or 20% of your initial position - to safeguard your capital [11].
Having clear stop-loss strategies in place can help you avoid misreading market signals and limit unnecessary risks.
Avoiding False Signals
A common mistake traders make is treating a touch of the bands as an automatic trading signal. As John Bollinger himself explains:
"Tags of the bands are just that, tags not signals. A tag of the upper Bollinger Band is NOT in-and-of-itself a sell signal." [12]
During strong trends, price can "walk the band", leading to multiple false reversal signals. To avoid this pitfall, focus on signals that align with the prevailing trend. For example, in a downtrend, only consider short trades when the price touches the upper band. Similarly, in an uptrend, look for long trades when the price reaches the lower band [4].
Volume confirmation is another key to avoiding false signals. When price breaks out of a squeeze, check for increasing volume. Expanding volume suggests institutional participation, making the breakout more likely to hold [4]. Keep in mind that closes outside the bands often indicate continuation rather than reversal. A trend may only be nearing exhaustion when the opposite band begins to change direction [12].
Finally, steer clear of trading in choppy, sideways markets. Bollinger Bands tend to produce unreliable signals in these conditions. Instead, focus on trades that emerge from a squeeze or contraction phase, where the bands have narrowed significantly before the breakout [4].
By validating signals and aligning your trades with the broader trend, you can improve your chances of success.
Risk/Reward Ratios for Bollinger Band Strategies
Each Bollinger Band strategy comes with its own risk/reward profile. Understanding these ratios can help you choose the approach that suits your trading style and risk tolerance.
| Strategy Type | Entry Signal | Stop-Loss Placement | Take-Profit Target | Typical Risk/Reward |
|---|---|---|---|---|
| Mean Reversion | Tag of outer band with RSI confirmation | Below swing low or above swing high | Middle MA or opposite band | 1:2 |
| Volatility Squeeze | Breakout after band contraction | Opposite side of consolidation | Band expansion or reversal | 1:3+ |
| Trend Following | Price breaks through ±1σ | Middle Moving Average (MA) | Reaching ±2σ or trailing MA | 1:1.5 |
| Fade Strategy | Trend exhaustion at outer band | Entry band + "no man's land" width | Middle MA or lower band | High Risk/High Reward |
The Volatility Squeeze strategy often provides the most attractive risk/reward ratio. By entering during low-volatility periods with a tight stop, you position yourself for a potentially large breakout move. Mean reversion trades offer moderate ratios, targeting the middle or opposite band after confirming an extreme. Meanwhile, trend-following setups tend to be more conservative, with higher win rates when executed in line with the overall trend.
Conclusion
Bollinger Bands offer a structured way to analyze price movements in futures markets. As John Bollinger himself put it:
"Bollinger Bands provide a relative definition of high and low. By definition price is high at the upper band and low at the lower band" [3]
From spotting a Squeeze before a breakout to observing price "walking the bands" during a strong trend, this indicator adjusts seamlessly to shifts in market volatility across any timeframe. It’s a versatile tool, but its real power lies in pairing it with complementary indicators like RSI or volume analysis. This combination helps confirm signals and provides a clearer picture of market dynamics.
Success with Bollinger Bands isn’t just about identifying patterns - it’s about interpreting what happens at the extremes. Band touches alone don’t guarantee action; it’s the context and confirmation around those touches that create actionable insights. Solid risk management is equally critical. Strategies like using volatility-based stops, keeping an eye on BandWidth to gauge the Squeeze, and tailoring position sizes to market conditions can make all the difference between consistent results and inconsistent ones.
Additionally, having the right tools to execute your strategies in real time is vital. Platforms like TraderVPS ensure your trading systems run smoothly with 24/7 uptime, fast NVMe storage, and DDoS protection. Whether you're capturing breakouts during high-volatility periods or holding positions as price tracks along the bands, reliable infrastructure ensures you stay on top of critical signals like %b and BandWidth.
When integrated into a comprehensive trading strategy and paired with disciplined risk controls, Bollinger Bands can become an essential tool for navigating the challenges of futures trading.
FAQs
How do I adjust Bollinger Bands for different market conditions?
To adjust Bollinger Bands for different market conditions, begin with the default settings: a 20-period simple moving average (SMA) and bands set at ±2 standard deviations. These defaults offer a reliable starting point, but tweaking them can help better align with market dynamics.
In high-volatility markets, you might shorten the SMA to 10–14 periods. This makes the bands more reactive to rapid price changes. At the same time, increasing the standard deviation multiplier to 2.5–3 can help filter out false signals. On the other hand, for low-volatility or range-bound markets, consider lengthening the SMA to 30–50 periods. This adjustment smooths out market noise, and lowering the standard deviation multiplier to 1.5–1.8 allows the bands to better capture smaller price movements.
It's crucial to back-test these changes using recent market data, ideally from the past six months, to confirm they improve signal reliability. Once you're satisfied with the performance, save your custom settings in your charting software for easy access as market conditions shift.
How can I avoid false signals when using Bollinger Bands?
To reduce the chances of acting on false signals with Bollinger Bands, think of them as a contextual tool rather than a stand-alone indicator. Don’t jump to conclusions just because the price touches the upper or lower band. Instead, confirm your analysis with additional indicators like RSI, MACD, or volume. For instance, a close outside the bands often suggests a trend continuation rather than an immediate reversal. It’s usually smarter to wait for a pullback or a clear reversal candlestick pattern before making any trading decisions.
For more reliable results, pair Bollinger Bands with trend-following tools, such as a 200-period moving average, to ensure your trades align with the market's overall direction. Keep an eye out for the Bollinger Squeeze, where the bands tighten significantly. This setup often hints at a breakout, but it’s best to trade these moves only when backed by strong volume or a confirming oscillator. By combining these strategies, you can greatly reduce the risk of acting on misleading signals.
How can Bollinger Bands and RSI be used together for stronger trade signals?
Bollinger Bands and the Relative Strength Index (RSI) make a strong pair because they focus on different aspects of the market. Bollinger Bands are great for spotting price extremes and gauging volatility, while RSI helps identify momentum and whether the market is overbought or oversold. Using them together can help confirm trade setups and reduce the chances of acting on false signals.
Here’s an example: If the price reaches the upper Bollinger Band and RSI climbs above 70, it often points to an overbought market, hinting at a potential reversal or shorting opportunity. On the flip side, if the price touches the lower band and RSI drops below 30, it suggests the market is oversold, signaling a possible bounce or a long entry. Traders also pay attention to RSI divergence - for instance, when the price hits a new low near the lower band, but RSI forms a higher low. This divergence can indicate weakening momentum and a stronger chance of a reversal.
After a Bollinger Band "squeeze" (when the bands tighten, signaling low volatility), RSI can help clarify the breakout direction. If RSI rises above 50, it supports a bullish breakout. Conversely, if RSI falls below 50, it points to a bearish breakout. Combining these tools allows traders to better validate their trade setups and make more informed decisions.


