
Premier Order Flow Tools for Futures
Order flow tools give futures traders real-time insights into market activity by showing the interaction between buyers and sellers, limit orders, and trade executions. These tools go beyond price charts to reveal market depth, liquidity changes, and execution patterns, helping traders make informed decisions. Popular platforms include TraderVPS, Jigsaw Trading, Bookmap, Sierra Chart, NinjaTrader, and Quantower. Each offers unique features like heatmaps, DOM (Depth of Market), and advanced visualization tools tailored to different trading styles.
Quick Highlights:
- TraderVPS: Focus on ultra-low latency and high performance for rapid trade execution.
- Jigsaw Trading: Advanced DOM and tape reading tools for scalpers and intraday traders.
- Bookmap: Liquidity heatmaps and real-time market visualization.
- Sierra Chart: Customizable tools with low-cost options and deep market analysis.
- NinjaTrader: Popular platform with integrated order flow tools for beginners and pros.
- Quantower: Modular, multi-asset support with flexible pricing.
These platforms cater to traders of various skill levels and needs, from scalping to multi-market analysis. Below, we break down their features, pricing, and strengths to help you choose the right tool for your trading strategy.
Order Flow Trading Platform Comparison: Features, Pricing & Best Use Cases
I Make A Living Trading With Order Flow (Here's How)
1. TraderVPS
TraderVPS provides a high-performance, low-latency environment tailored for order flow analysis, making it a solid choice for traders who demand speed and reliability.
Infrastructure Performance
TraderVPS hosts its servers in Chicago's Equinix data centers, strategically located near the CME Group to minimize latency. These servers are powered by enterprise-grade AMD EPYC processors, NVMe storage, and generous amounts of RAM to handle even the most volatile market conditions without bottlenecks. With unmetered bandwidth on networks exceeding 1Gbps (and up to 10Gbps for dedicated servers), TraderVPS ensures smooth handling of high data throughput.
Execution Speed
With sub-0.52ms latency to the CME and a 99.999% uptime guarantee, TraderVPS is built for traders who need rapid execution, such as scalpers and tape readers. As QuantVPS notes, "Ultra-low latency is critical for rapid futures trade execution and minimizing slippage" [9]. To put its capabilities in perspective, over $16.46 billion was traded within a single 24-hour period on December 22, 2025, using these optimized servers [9]. This combination of speed and reliability is paired with flexible pricing to accommodate different trading needs.
Pricing and Accessibility
TraderVPS offers four plans, each designed to cater to various trading requirements:
- VPS Lite: $69/month - 4 AMD EPYC cores, 8GB RAM, 70GB NVMe storage.
- VPS Pro: $99/month - 6 cores, 16GB RAM.
- VPS Ultra: $199/month - 24 cores, 64GB RAM, supporting up to four monitors.
- Dedicated Server: $299/month - 12+ AMD Ryzen cores, 128GB RAM, 2TB+ NVMe storage, supporting up to six monitors.
All plans include essential features like DDoS protection, automatic backups, and compatibility with major futures data feeds such as Rithmic, CQG, dxFeed, TT, and IQFeed. Traders can also manage their VPS remotely using a web-based system, ensuring they stay connected and in control no matter where they are.
2. Jigsaw Trading
Jigsaw Trading focuses on providing clarity in order flow with its price ladder and tape reading tools. At the heart of its offerings is the Depth & Sales tool, which reimagines the Depth of Market (DOM) to uncover trapped positions and highlight shifts in order flow [2].
Order Flow Features
Jigsaw's Reconstructed Tape groups trades to reflect actual market sizes, making it easier to interpret market activity. The platform also includes Order Flow Event Alerts, which notify traders of key occurrences like iceberg orders, block trades, delta divergence, and buyer/seller absorption [2][8][10][11]. The Pace of Tape gauge tracks transaction speed compared to historical averages, helping traders spot momentum changes at critical points [2]. Additionally, the queue position display shows your exact place in the exchange order queue, enabling better timing for entries and exits [2]. Together, these tools provide a comprehensive view of market activity, giving traders a clearer edge.
Visualization Capabilities
The Auction Vista feature offers a historical heatmap of market depth, allowing traders to visualize liquidity and identify high-volume zones and potential turning points [2]. However, some describe the heatmap as resembling a "frame-by-frame snapshot" [8]. For thicker markets like the S&P 500 or Treasuries, traders often rely on Jigsaw's DOM for trade confirmations, while the tape reading tools are particularly effective in thinner markets like Gold or Crude Oil [6]. Despite its focus on visualization, the platform ensures that execution speed and performance remain top-notch.
Execution Speed
The daytradr platform is designed for speed, using a multi-threaded system to keep up with fast-moving markets [1][2]. One-click trading allows users to quickly place, modify, or cancel orders directly from the DOM or Auction Vista chart [2]. Jigsaw Trading emphasizes the platform's reliability:
"Jigsaw daytradr also has multiple layers of redundancy built in so that it's always there when you need it and doesn't fall behind in fast markets" [1].
The platform connects seamlessly to major data feeds like CQG, Rithmic, StoneX, Tradovate, Interactive Brokers, and IQFeed [2].
Pricing and Accessibility
Jigsaw offers its software and training through a one-time payment system, with an optional subscription for live trading:
- Independent Package: $579 - includes core tools and lifetime access to Journalytix.
- Professional Package: $879 - adds advanced features and training.
- Institutional Package: $1,979 - includes the full suite with premium support.
Live trading access costs an additional $50 per month or $500 annually [1][12]. All packages come with lifetime access to Journalytix, a cloud-based analytics tool for automated trade journaling, and a 14-day money-back guarantee on the software [1][12]. These features aim to enhance decision-making in futures trading by offering detailed insights into market activity. John Grady, CEO of No BS DayTrading, highlights the platform's strengths:
"It shows the ebb and flow of the volume very, very well. Customer service is excellent, any time you have a problem, they respond very quickly" [1].
3. Bookmap
Bookmap takes a fresh approach to order flow analysis, offering traders a unique way to visualize market activity. Drawing on insights from TraderVPS and Jigsaw Trading, Bookmap transforms order flow data into dynamic liquidity heatmaps, giving traders a clear view of the limit order book. Unlike traditional candlestick charts, which can obscure much of the market data, Bookmap reveals the "hidden battlefield" of resting orders. This provides a different perspective, allowing traders to identify support and resistance levels before price movements occur [16][17]. With updates running at up to 40 frames per second, the platform delivers a continuous, real-time view of market activity [16][17].
Order Flow Features
Bookmap's Liquidity Heatmap uses color-coded visuals to show where resting limit orders are concentrated. Bright areas indicate high liquidity zones, often where large market players are active, while darker areas indicate low liquidity where price can move more freely [7][15]. Volume Bubbles represent executed trades, highlighting both trade volume and direction [7][14]. The Stops & Icebergs Tracker uncovers hidden institutional activity and stop clusters, which can lead to sharp price fluctuations [7][4]. For those who need a granular view, Market-by-Order (MBO) data reveals individual order placements and cancellations, rather than presenting aggregated levels [4][13]. These tools provide traders with a deeper understanding of market dynamics.
Visualization Capabilities
Bookmap excels in visualization, offering tools like Nanosecond Zoom, which allows traders to analyze the market microstructure in extreme detail. This feature captures every liquidity and volume update in real-time [7]. The Record & Replay feature is another standout, enabling traders to review sessions tick by tick, perfect for backtesting strategies or learning from past market behavior [7][15]. By adding a time element to the order book, traders can observe how liquidity is added, removed, or absorbed. For example, when aggressive volume bubbles hit a high-liquidity zone but fail to break through, it may signal a potential price reversal [14][17]. These tools turn raw data into actionable insights.
Execution Speed
For fast-moving markets, Bookmap supports one-click chart trading, allowing direct order placement from the platform. It integrates seamlessly with major futures brokers and data providers, such as CQG, Rithmic, and Interactive Brokers [15][1]. To fully leverage its advanced indicators in markets like ES (E-mini S&P 500) and NQ (E-mini Nasdaq-100), professional data feeds like Rithmic, dxFeed, or BookmapData (CME) are recommended to access full-depth market data [7][4].
Pricing and Accessibility
Bookmap offers several pricing plans to suit different needs. The Global Plan starts at $49 per month ($39 per month with annual billing or $990 for lifetime access) and includes simulated trading and access to 20 symbols. The Global+ Plan costs $99 per month ($79 per month with annual billing or $1,990 for lifetime access) and includes compatibility with all add-ons, advanced education, and BookmapLIVE daily trading sessions [18]. For those just getting started, a Digital Plan is available for free, offering delayed futures data for one symbol. Data feeds are sold separately, with 24-hour historical futures data priced at $14 per month per exchange [18]. Bookmap is available as a desktop application for in-depth analysis or as a web-based version for traders who need flexibility across devices [13].
4. Sierra Chart
Sierra Chart's architecture, built entirely in C++, offers impressive speed and dependability. Its design operates close to the hardware, utilizing multi-core CPU processing for tasks like handling market data and loading charts. This ensures the platform remains responsive, even during high-volume trading sessions. Like other platforms mentioned earlier, Sierra Chart uses advanced technology to deliver detailed market insights, particularly through its order flow analysis. [19]
Order Flow Features
Sierra Chart's Numbers Bars (also known as Footprint) provide a detailed breakdown of trading activity. These bars display numerical data for volume, ask volume, bid volume, and delta at each price level, offering traders a clear view of buying and selling dynamics. The platform processes tick-by-tick data to ensure precise volume analysis, capturing every trade. Its Market Depth Historical Graph visualizes changes in liquidity over time, helping traders spot institutional activity before major price shifts. For deeper insights, TPO Profile Charts (Market Profile) track the time spent at specific price levels, while the Trading DOM includes features like pulling and stacking columns and recent bid/ask volume. When paired with the Denali Exchange Data Feed, traders gain access to up to 1,400 levels of market depth. [27,29]
Visualization Capabilities
Sierra Chart's visualization tools are designed to cut through market noise and highlight critical trading activity. The Reconstructed Tape study consolidates raw trade data into volume bubbles, making it easier to identify sweeps and large block trades. Slippage Lines measure the market impact of large orders by showing how far prices move during execution, helping traders distinguish between passive absorption and aggressive moves. The DOM Graph adds a real-time histogram of bid and ask quantities directly onto the chart, displaying total volume percentages and spread. Additionally, the platform offers chart replay speeds ranging from 0.1 to 100,000 times real-time, allowing traders to backtest strategies or review trading sessions with precision. These visualization features work seamlessly with Sierra Chart's execution tools, making it a comprehensive platform for order flow analysis. [27,31,32]
Execution Speed
When it comes to low-latency execution for CME futures, Sierra Chart's Teton Futures Order Routing service stands out. This proprietary system provides direct routing to CME Group exchanges, including CME, CBOT, NYMEX, and COMEX, with no transaction fees. The platform supports server-side OCO (Order Cancels Order) and bracket orders, ensuring efficient execution. Its Chart DOM integrates a fully functional trading DOM directly onto the chart, enabling one-click order placement. By combining its native C++ architecture with direct connectivity, Sierra Chart minimizes execution lag and maximizes stability. [12,28]
Pricing and Accessibility
Sierra Chart offers tiered Service Packages to meet different trading needs. These range from basic charting options to advanced integrated trading with Market by Order (MBO) data. The platform distinguishes between Base Packages, which are limited to Sierra Chart's internal services, and Integrated Packages, which support external services like Interactive Brokers, CQG, and Rithmic. While real-time data from major exchanges may require additional fees, delayed data - as well as real-time Forex, CFD, and crypto data - are often included at no extra cost. The Simulated Futures Trading Service provides access to at least three years of order fill history, making it a valuable tool for practice and analysis. Additionally, the platform is portable, with all data and configuration files stored locally for easy access. [12,29,33]
5. NinjaTrader
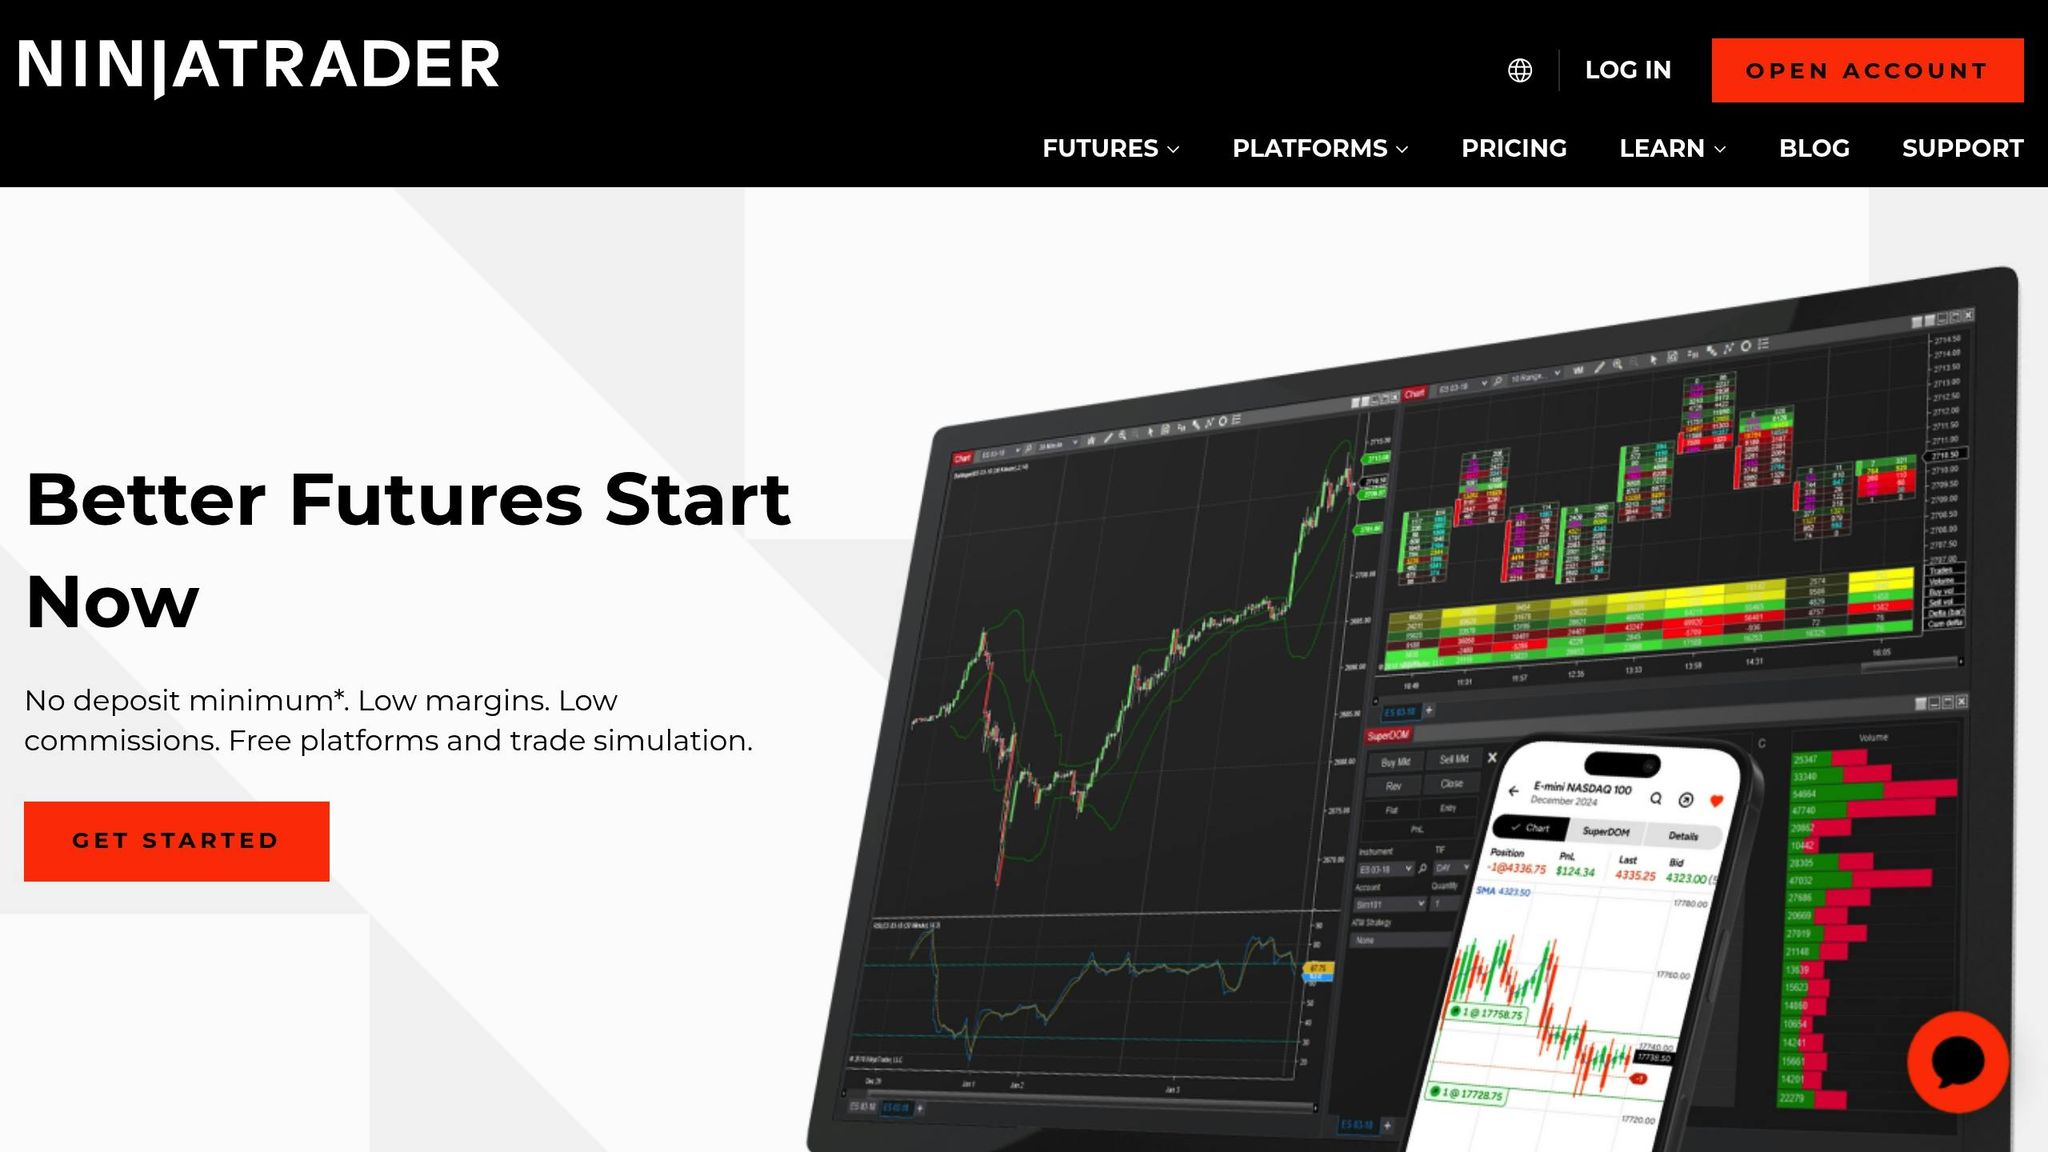
NinjaTrader's Order Flow+ Suite - which includes tools like Volumetric Bars, Cumulative Delta, Market Depth Map, Trade Detector, VWAP, and Volume Profile - has become a trusted choice among futures traders [20]. With a global user base exceeding 1 million, it stands out as one of the most popular platforms in the retail futures trading space [20].
Order Flow Features
NinjaTrader's Volumetric Bars provide a detailed breakdown of bid versus ask volume at each price level within a bar. This helps traders spot imbalances, absorption patterns, and the all-important Point of Control (POC). The Cumulative Delta tracks net buying and selling pressure, offering insights into divergences - such as when prices hit new highs without a corresponding increase in delta. The Trade Detector highlights large block trades and significant volume clusters, often signaling institutional activity. Meanwhile, the Market Depth Map visualizes the limit order book as a heatmap, making it easier to see where liquidity is concentrated.
"Order flow focuses on how price got there by showing the volume of trades happening at each price and who's initiating them (buyers or sellers)." – NinjaTrader Team [20]
These tools combine to deliver intuitive, data-driven visualizations, making market analysis more precise and actionable.
Visualization Capabilities
NinjaTrader's visualization tools go beyond the basics, helping traders understand the intent and momentum behind price movements. For example, Volumetric Bars highlight areas of aggressive buying or selling, revealing defended or breached price levels. The Volume Profile pinpoints key support and resistance zones, while VWAP (with standard deviation bands) provides a benchmark for fair value. Together, these tools give traders a more complete picture of market activity, helping them avoid overreacting to individual volume spikes or imbalances.
Execution Speed
NinjaTrader doesn't just excel at visualizing data - it also delivers the speed needed for fast-paced trading. Its multi-threaded architecture ensures smooth performance, even during periods of high market volatility [2]. The platform's SuperDOM feature allows for direct market access with one-click order placement, seamlessly integrating with the Order Flow+ tools for efficient execution. For those requiring additional performance, NinjaTrader works with optimized VPS hosting solutions [see Section 1] [2].
Pricing and Accessibility
NinjaTrader offers options for both beginners and advanced traders. The free version supports third-party indicators but has limited built-in order flow tools [21]. The $99/month version unlocks full trading capabilities, including the Order Flow+ suite [21]. CME market data is available for around $12 per exchange per month or bundled for $30–$40. For traders with a funded account who execute at least one trade monthly, promotional rates can drop as low as $4 per month [21].
New users can also take advantage of a 14-day trial of live simulated futures trading. This trial provides a risk-free way to explore the platform's order flow tools and gain hands-on experience [3].
6. Quantower
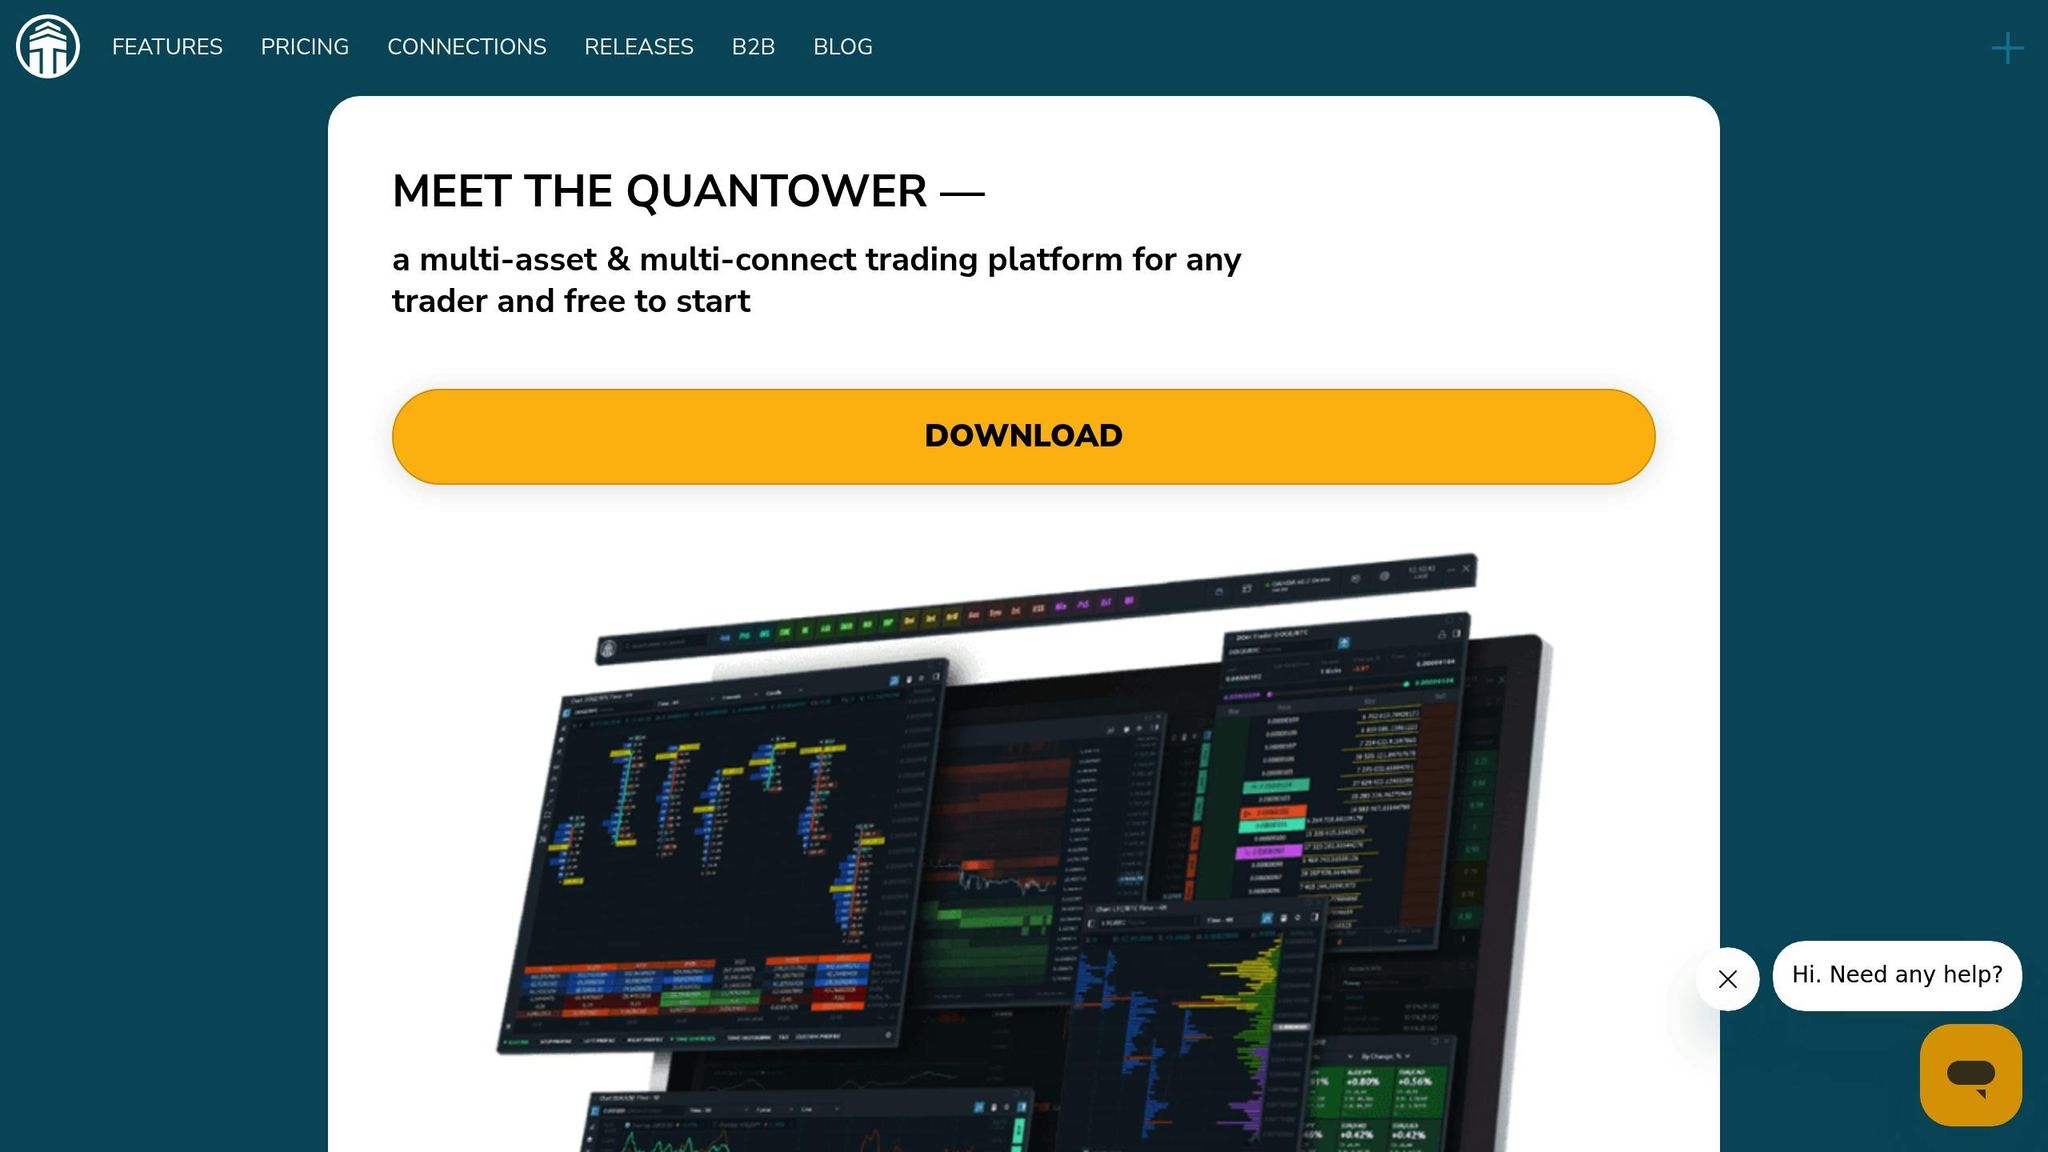
Quantower stands out as a modular trading platform that combines features like DOM, charts, and volume profiles into customizable workspaces [22]. Unlike platforms that stick to one style of analysis, Quantower supports multiple asset classes - futures, crypto, stocks, and ETFs - all within a single interface [23]. This "all-in-one" approach appeals to traders who prefer centralized tools, though the platform’s extensive customization options might take some time to master [22].
Order Flow Features
Quantower’s order flow tools are built to provide deep market insights. Key features include Cluster Charts (footprints), Volume Profiles with Point of Control (POC) and Value Area, and Historical Time & Sales, which lets users analyze past trade data within individual candles [23]. The DOM Surface uses a heatmap to track liquidity changes at every price level, helping traders pinpoint significant limit orders [23]. Additionally, the Power Trades Scanner detects unusual trading activity, such as large volumes executed in under a second, while the Order Book Imbalance feature offers a real-time histogram of the bid-to-ask ratio - a potential indicator of price movement [25]. These tools make Quantower a strong contender in the order flow analysis space.
Visualization Capabilities
Quantower’s visualization tools provide traders with a clear picture of market activity. The DOM Surface Heatmap uses brightness to highlight areas with high order concentrations, making it easier to spot key consolidation levels [25]. Cluster Charts combine price, volume, time, and order flow into one detailed view, showing how volume is distributed within each candle. For broader market insights, TPO (Time Price Opportunity) profiles identify market equilibrium zones, while tools like VWAP and Volume Profile help traders locate critical support and resistance levels [23]. When paired with premium data feeds like dxFeed, Quantower delivers institutional-grade market depth and a detailed tick history [22].
Execution Speed
Quantower doesn’t just focus on analysis - it also prioritizes fast and efficient execution. The platform supports connections to over 60 brokers, exchanges, and data feeds simultaneously [23]. Its multi-threaded architecture ensures quick order processing, allowing traders to create synthetic symbols and manage spreads across multiple connections. For those who need ultra-low latency, Quantower’s VPS solutions achieve response times as fast as 0.52 milliseconds to the CME Group’s matching engines in Chicago, making it a reliable choice for high-frequency trading [26].
Pricing and Accessibility
Quantower offers flexible pricing to suit different needs. The Free Edition (no registration required) allows for basic use with up to two indicators per chart and one active connection. For full access, the All-in-One License is available at $70/month, unlocking features like DOM Surface, Power Trades, and Volume Analysis. Discounts are available for longer commitments: 10% off for three months, 20% off for six months, and 30% off for annual subscriptions [27][28]. Alternatively, users can purchase individual tools like Volume Analysis ($35/month), DOM Surface ($30/month), and Power Trades ($25/month) [27]. A lifetime license is also available for a one-time payment, though refunds are not offered for this option [27]. Notably, Optimus Futures clients will enjoy broker-sponsored access at no additional cost in 2026, eliminating standard license fees [24]. For those curious to explore its full potential, a 7-day free trial of all professional tools is available upon registration [27].
Advantages and Disadvantages
Building on the detailed order flow analyses above, let’s dive into the specific strengths and weaknesses of each platform.
Jigsaw Trading is widely recognized for its professional-grade DOM price ladder. It comes packed with features like Auction Vista for historical order flow and a reconstructed tape that unbundles CME data[2][8]. Despite these strengths, its heatmap visualization can feel less smooth compared to competitors, and the Circle Tuner operates on a 1–10 scale instead of offering precise volume thresholds[8]. John Grady, CEO of No BS DayTrading, shared high praise for the platform:
"I think it is the best platform 'hands-down'… you just see certain things in it that you don't see in other platforms. It shows the ebb and flow of the volume very, very well"[1].
Bookmap shines with its exceptional heatmap visualization, which updates an impressive 125 times per second. It also offers precise volume dots and uncovers hidden liquidity, icebergs, and absorption levels[17]. However, its traditional DOM display lacks visual appeal, and the order entry system - based on left, right, and middle mouse clicks - can be unintuitive, especially for new users[8]. Trade Runner summed it up well:
"It's with its orderbook heatmap that Bookmap excels"[8].
NinjaTrader provides a robust Order Flow+ suite, including tools like Volume Profile, VWAP, and Cumulative Delta. Its large community and 14-day free trial make it an appealing choice for beginners[3]. On the downside, the platform’s default DOM is often seen as weaker compared to specialized tools, and some users have criticized it for platform bloat when compared to standalone order flow solutions[8].
Here’s a quick comparison of the platforms’ key advantages and disadvantages:
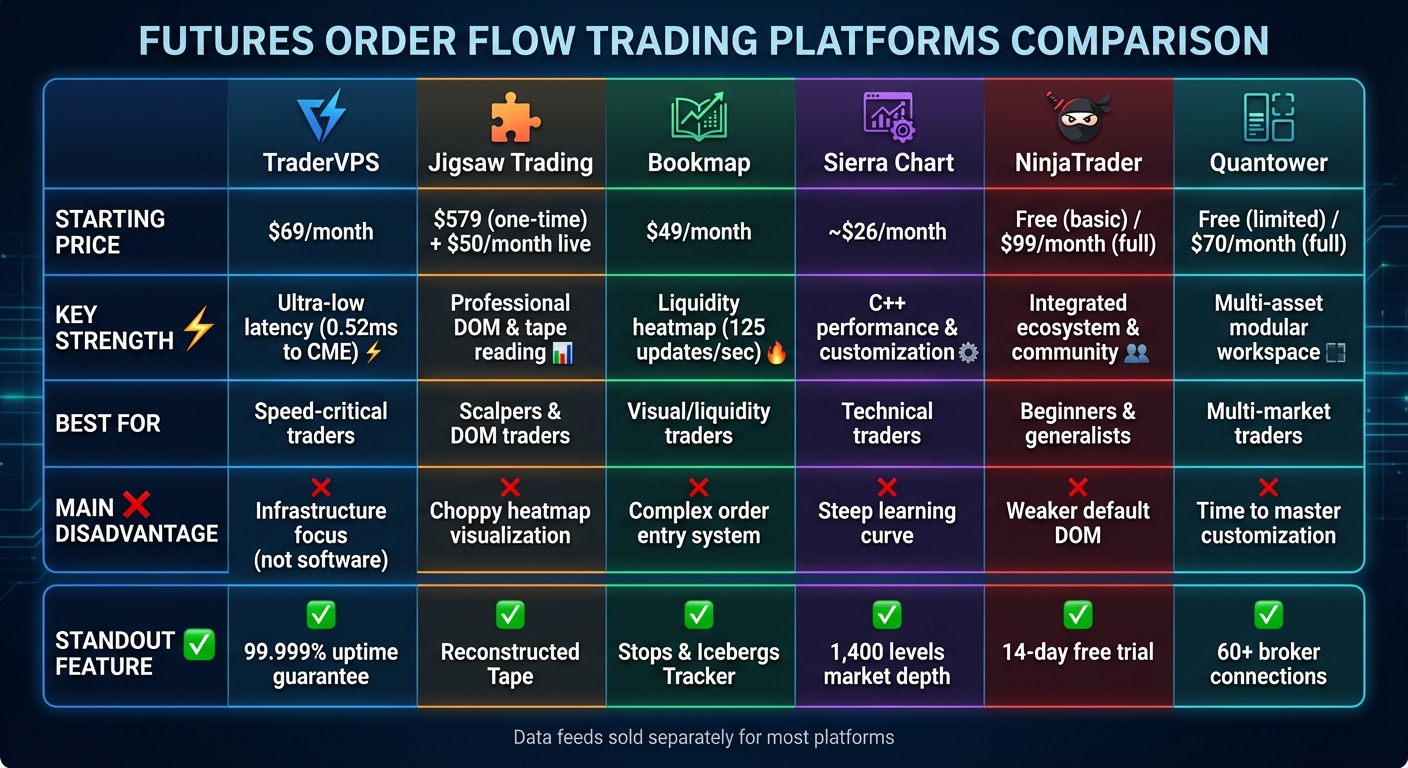
| Tool | Key Advantages | Main Disadvantages | Best For |
|---|---|---|---|
| Jigsaw Trading | Professional DOM; Auction Vista; reconstructed tape; multi-level education | Choppy heatmap; 1–10 volume scale instead of precise thresholds | DOM traders, scalpers |
| Bookmap | High-speed heatmap (125 updates/sec); precise volume dots; iceberg detection | Less appealing traditional DOM; complex order entry system | Visual/liquidity traders |
| NinjaTrader | Integrated ecosystem with Order Flow+ suite; 14-day free trial; large community | Inferior default DOM; platform bloat | Beginners, generalists |
| Sierra Chart | High performance; low cost (around $26/month); extreme customization | Steep learning curve; complex interface | Technical traders |
| Quantower | Modular workspaces; multi-asset support; free edition available | Extensive customization requires time to master | Multi-market traders |
Each platform has its strengths, whether it’s catering to scalpers, technical traders, or beginners. Your choice will depend on your trading style and priorities.
Conclusion
Selecting the best order flow tool hinges on your trading style and the types of markets you engage with. Each platform offers a unique mix of execution features, visualization tools, and customization options, tailored to different needs.
For scalpers operating in highly liquid markets, Jigsaw Trading's professional DOM is a strong choice. Meanwhile, Bookmap's heatmap, which refreshes 125 times per second, is ideal for traders who rely on visualizing liquidity and spotting potential reversals[4]. If you're an active intraday trader, NinjaTrader provides a comprehensive ecosystem with built-in tools like Cumulative Delta and Volume Profile, making it a popular option[3]. For those who prioritize performance and customization, Sierra Chart's C++ architecture ensures stability and flexibility. On the other hand, Quantower stands out for traders managing diverse asset classes, thanks to its modular workspace design.
The effectiveness of these tools also depends on the market conditions. For instance, a DOM thrives in markets where prices stick to precise levels, while tools like Reconstructed Tape and Power Meters shine in faster-moving environments that indicate institutional activity[5][6]. Beginners may find NinjaTrader's active community particularly helpful as they learn the ropes.
For high-frequency trading strategies, having a reliable infrastructure is just as important as the software itself. Running these tools on a VPS optimized for futures trading can ensure smooth performance, especially during high-volatility events when local systems might falter. By aligning your trading strategy with the analytical strengths of your chosen platform and a solid technical setup, you can achieve better results - whether you're scalping with a DOM, analyzing liquidity for day trades, or conducting multi-timeframe studies across correlated futures contracts.
FAQs
What are the key advantages of using order flow tools in futures trading?
Order flow tools give futures traders a real-time snapshot of market activity, offering insights that go beyond what traditional charts can provide. These tools display crucial details like market depth, trade volume, and the buying or selling pressure at various price levels. This helps traders pinpoint where significant market players are most active.
Using visual aids like heatmaps, volume bubbles, and liquidity clusters, traders can uncover hidden support and resistance levels, identify large trades, and spot patterns such as spoofing or iceberg orders. This added layer of information allows traders to make quicker, more informed decisions, enhancing precision and minimizing costly errors in fast-moving markets.
Many order flow tools also come equipped with alerts for unusual activity, such as sudden spikes in volume or delta divergence, allowing traders to react promptly. Armed with these insights, traders can better anticipate market movements and fine-tune their trade entries and exits for maximum effectiveness.
How does TraderVPS deliver low latency and high performance for futures traders?
TraderVPS is built to deliver lightning-fast performance and minimal latency, thanks to advanced infrastructure specifically tailored for futures traders. By positioning data centers near key trading exchanges, TraderVPS reduces the physical distance between your platform and the market. The result? Faster trade execution and fewer delays.
The platform also utilizes high-speed servers with optimized network connections, making it capable of processing large amounts of data in real time. This ensures traders can seamlessly analyze order flow, market depth, and trade execution dynamics without disruptions. In fast-paced futures markets, this level of reliability and speed gives traders the tools they need to make sharp, data-driven decisions with confidence.
What is the best platform for visualizing order flow in futures trading?
For futures traders looking for top-notch visualization tools, Bookmap is hard to beat. Its real-time Liquidity Heatmap offers a clear, dynamic look at limit orders across different price levels, while the Volume Bubbles make it easy to spot executed volumes and buyer-seller imbalances. Plus, with its nanosecond-level zoom, traders can dive deep into the market's microstructure with precision - all within a smooth, continuously updating interface.
Though other platforms provide visualization features, Bookmap's extensive toolset delivers unmatched detail and clarity. It's a favorite for traders who rely on in-depth insights into market depth and order flow.


