
Complete Hammer Pattern Tutorial for Traders
The hammer candlestick pattern is a key signal for traders, often indicating a potential reversal in a downtrend. Its structure - a small body near the top, a long lower shadow, and little to no upper shadow - shows sellers losing control as buyers step in. This pattern works best when confirmed by high volume and appears near support levels or after a clear downtrend. Key points include:
- Identification: Look for a small body at the top of the range and a lower shadow 2–5 times the body length. Minimal upper shadow is ideal.
- Confirmation: Wait for the next candle to close above the hammer's high before entering a trade.
- Volume: A volume spike (150%+ of the 10-period average) strengthens the signal.
- Risk Management: Place stop-loss slightly below the hammer's low and aim for a 2:1 or better reward-to-risk ratio.
Traders can also combine hammer patterns with tools like RSI or Fibonacci levels for better accuracy. Platforms like TradingView or TrendSpider simplify pattern detection and help automate analysis. Backtesting shows a 60% success rate for reversals, but selectivity and discipline are key to success.
The Hammer Candlestick Pattern 🔨 Master the Hammer Pattern (In JUST 4 Minutes)
How to Spot Hammer Patterns on Charts
Hammer vs Similar Candlestick Patterns: Visual Comparison Guide
Recognizing hammer patterns on charts is a crucial skill for traders, especially when it comes to identifying potential reversals. To ensure these patterns provide meaningful signals, they must appear after a clear downtrend or pullback. Once the context is established, focus on the hammer's key features and avoid common mistakes that can lead to misinterpretation.
Characteristics of a Valid Hammer
For a hammer to be considered valid, it needs to meet specific criteria:
- A small body positioned near the top of the candle.
- A lower shadow that is at least twice the length of the body (and often three to five times longer), making up at least two-thirds of the candle's total length.
- A negligible or non-existent upper shadow [1][2].
Volume also plays a critical role. To confirm the hammer's signal, the trading volume should be at least 150% of the 10-period average [1]. The pattern becomes even more reliable when it forms near strong support levels, key moving averages, or Fibonacci retracement zones.
Common Mistakes When Identifying Hammers
Even with a solid understanding of the criteria, traders can fall into certain traps when identifying hammers. One major mistake is jumping into a trade too early. Always wait for the next candle to close above the hammer's high to confirm the reversal signal [1].
Another common error is mistaking hammers for similar-looking patterns. For example:
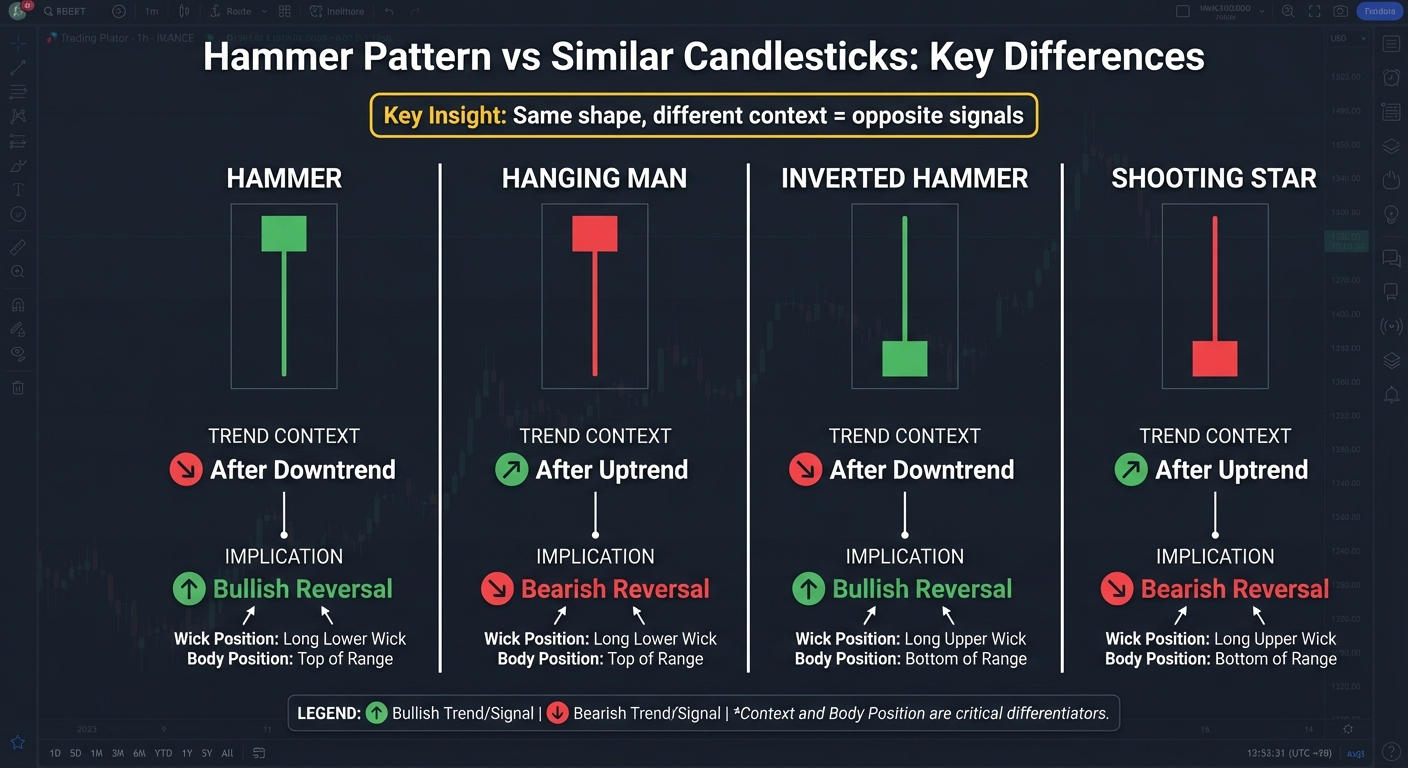
- Hanging Man vs. Hammer: Both share the same shape (a small body with a long lower wick), but the context matters. A hammer appears after a downtrend and signals a bullish reversal, while a hanging man forms after an uptrend, indicating a bearish reversal [4][6].
- Inverted Hammer vs. Hammer: An inverted hammer has a long upper shadow instead of a lower one. However, when it forms after a downtrend, it can also suggest a potential bullish reversal [1][4].
| Feature | Hammer | Hanging Man | Inverted Hammer | Shooting Star |
|---|---|---|---|---|
| Trend Context | After Downtrend | After Uptrend | After Downtrend | After Uptrend |
| Implication | Bullish Reversal | Bearish Reversal | Bullish Reversal | Bearish Reversal |
| Wick Position | Long Lower Wick | Long Lower Wick | Long Upper Wick | Long Upper Wick |
| Body Position | Top of Range | Top of Range | Bottom of Range | Bottom of Range |
Proportions also matter. A "partial hammer" - where the lower shadow is only 1.5 times the body length - lacks the statistical reliability of a proper hammer that fully meets the criteria [1]. Additionally, ignoring volume can lead to misjudgments. A hammer with low trading volume is less likely to trigger a genuine reversal [1].
Trading Strategies Using the Hammer Pattern
Entry and Confirmation Techniques
To confirm a hammer pattern's reversal, wait for the next candle to close above the hammer's high. This step helps weed out false signals and ensures a stronger setup [1].
Your entry method will depend on your trading style. Conservative traders should wait for the confirmation candle to close, ensuring the bullish momentum is legitimate before entering [5]. Aggressive traders, on the other hand, might jump in as soon as the price breaks above the hammer's high or during a brief pullback into the upper third of the hammer - especially when the pattern aligns with a major support level or key moving averages [5].
Volume adds another layer of confirmation. Look for volume on the hammer or confirmation candle to be at least 150% of the 10-period average [1]. High volume often signals institutional activity, reinforcing the likelihood of a reversal. Also, check higher timeframes. For example, an hourly hammer signal may be less convincing if the daily trend remains strongly bearish. Historical data suggests hammer patterns reverse the prior trend about 60% of the time [5].
Setting Stop-Loss and Take-Profit Levels
Once you've confirmed your entry, managing risk with well-placed stop-loss and take-profit levels is crucial. Place your stop-loss slightly below the hammer's low - this could be around 10–15 cents or 0.2–0.3 ATR (Average True Range) lower [1][8]. If the price dips below this level, it typically invalidates the pattern.
For profit targets, aim for a reward-to-risk ratio of at least 2:1 or 3:1 [8]. You can also use the hammer's length to project a target by adding its total height to the high of the pattern [2]. Alternatively, consider targeting nearby resistance levels, previous swing highs, or important moving averages. A useful strategy is scaling out - taking partial profits at the first resistance level while holding the remaining position to capture larger moves [5].
For instance, Boeing (BA) formed a hammer at $169.86 during a 23% decline, then surged to $206.61 by January 31, 2022, confirming the reversal [8].
Combining Hammer Patterns with Technical Indicators
To enhance the reliability of your trades, combine hammer patterns with technical indicators. For example, use the Relative Strength Index (RSI) to confirm oversold conditions. Look for RSI readings below 30 or bullish divergence, where the price forms a lower low while the RSI makes a higher low [1]. The MACD can also validate the signal - watch for a shrinking negative histogram or a bullish crossover [5].
Moving averages provide additional context. Hammers that form near or reclaim significant moving averages, such as the 20-period, 50-day, or 200-day, tend to be more reliable [5]. Patterns that appear in the lower third of the yearly price range and close as bullish (green) candles are also stronger signals [5]. Using these indicators alongside the hammer pattern can fine-tune your stop-loss and take-profit strategies.
| Strategy Component | Conservative Approach | Aggressive Approach |
|---|---|---|
| Entry Point | Close of the confirmation candle | Break above the hammer's high |
| Stop-Loss | Below the hammer low + ATR buffer | At the hammer's low |
| Take-Profit | 1:1 measured move or nearest resistance | 1:3 risk-reward or major Fibonacci level |
| Confirmation | High volume on follow-through candle | Hammer shape and support level |
Hammer Pattern Examples in Different Market Conditions
Bullish Reversal in a Downtrend
Boeing (BA) offers a textbook example of how hammer patterns can signal a bullish reversal during a downtrend. After experiencing a steep 25% decline from $233 to $180, Boeing formed a bullish hammer on January 28, 2022. That day, the stock hit an intraday low of $169.86 before recovering to close at $186.61. Just three days later, on January 31, a strong confirmation came through with heavy trading volume and a gap up to $206.61[9]. This scenario illustrates how hammer patterns can effectively mark the end of a downtrend, providing a clear signal for potential trend reversals.
Using Fibonacci Levels with Hammer Patterns
Hammer patterns become even more effective when combined with Fibonacci retracement levels. For instance, in late 2022, a trader analyzing the CAD/JPY daily chart noticed a downtrend accompanied by a bullish divergence on the RSI. Near a critical Fibonacci retracement level - specifically within the 50% or 61.8% range - both an inverted hammer and a standard hammer appeared. After a bullish confirmation candle followed, the trader entered a long position, placing a stop-loss just below the hammer's low and targeting a 1:2 risk-to-reward ratio. The pair then steadily climbed to hit the profit target[3].
"A hammer appearing near major support levels, trendlines, or Fibonacci retracement zones dramatically enhances reliability." – Investopedia[3]
This case emphasizes the importance of combining multiple technical signals. While the hammer pattern alone hinted at a potential reversal, its alignment with Fibonacci levels and the RSI divergence added extra layers of confirmation. Together, these factors helped the trader focus on a higher-probability setup, increasing the likelihood of success.
Automating Hammer Pattern Detection
Tools for Hammer Pattern Recognition
Scanning for hammer patterns manually across numerous assets is not just time-consuming - it’s nearly impossible. That’s where platforms like TradingView shine. With its Pine Script indicators, such as "Candlestick Structure [LuxAlgo]" or "Hammers & Stars Strategy", traders can automate pattern detection and receive instant alerts[11]. These scripts can be customized to identify hammers with a lower wick that’s 2–3 times the size of the body, while also applying filters for volume and ATR thresholds[11][10]. This approach takes the guesswork out of manual analysis and streamlines trading decisions.
Another standout tool is TrendSpider, which features a Market Scanner capable of analyzing entire indices, like the S&P 500, for hammer or inverted hammer patterns - all in one go[10]. Instead of flipping through hundreds of charts, traders can pinpoint opportunities quickly and efficiently. For those leaning toward algorithmic trading, QuantConnect offers the LEAN engine, equipped with a built-in Hammer helper method that works seamlessly with Python and C#[12]. This allows traders to programmatically update indicators as new data arrives, bringing a whole new level of automation to the table.
Here’s a quick comparison of these tools:
| Platform | Detection Method | Best For |
|---|---|---|
| TradingView | Pine Script Indicators | Community-driven scripts and visual alerts[11] |
| TrendSpider | Market Scanner | Scanning multiple assets and timeframes simultaneously[10] |
| QuantConnect | LEAN Engine API | Algorithmic trading and advanced backtesting[12] |
| LuxAlgo | Specialized Indicators | Trend filtering and dashboard-style pattern tracking[11] |
To fine-tune your automated system, consider adding filters. For instance, flag hammers only when volume exceeds 150% of the 10-period average[1]. You can also incorporate confluence checks, such as an RSI below 30 or proximity to key Fibonacci retracement levels[3][5]. Some traders even use AutoView to connect TradingView alerts directly to brokerages like Oanda, enabling automated execution when all criteria are met[11].
Backtesting Hammer Strategies
Before risking real money, backtesting is essential to evaluate the reliability of a hammer strategy. Historical data shows that hammer patterns confirm about 61.9% of the time across 4,120 markets. However, they only achieve a 2:1 reward-to-risk target 40.8% of the time[14]. On average, this translates to just $0.225 earned for every $1 risked[14]. Clearly, not every setup is worth pursuing, making selectivity key.
"The hammer candlestick pattern is a frequently-occurring, one-bar bullish reversal Japanese candlestick pattern that is best traded using a bearish continuation strategy in all markets according to multiple decades of historical backtesting." – Leo Smigel, Founder, Analyzing Alpha[13]
Interestingly, backtesting over 21 years reveals that hammers often perform better as bearish continuation patterns rather than bullish reversal signals[13]. In crypto markets, for example, bearish continuation trades yield an edge of 0.550 at a 5:1 risk-reward ratio, compared to 0.375 for bullish mean reversals[13]. These findings challenge conventional wisdom and highlight the importance of testing strategies against historical data.
For better results, focus on H1 or higher timeframes to minimize noise[5]. Wait for a confirmation candle to close above the hammer’s high before entering a trade[10][3]. Use ATR-based stop-losses, placing them 0.2–0.3 ATR below the hammer’s low[5]. Testing these parameters under different market conditions can help refine your approach.
Conclusion
Key Takeaways for Traders
The hammer pattern can be a valuable tool for traders when used with precision, but success relies heavily on accurate identification, confirmation, and disciplined risk management. A proper hammer is characterized by a lower shadow that's at least twice the length of the body, a small body positioned at the top of the range, and a minimal upper shadow [3]. It's crucial to look for hammers forming after a downtrend or near significant support levels [3][5].
Instead of trading immediately on the hammer candle, wait for the next candle to close above the hammer's high. This confirmation step is critical, as backtesting indicates a success rate of about 60% [3][5][7].
Risk management is non-negotiable [7]. Place your stop-loss just below the hammer's low, with a small buffer - around 10–15 cents or 0.2 times the Average True Range (ATR) - to account for minor price fluctuations [1]. Ensure your potential reward is at least twice the amount you're risking to maintain a favorable risk-reward ratio [1].
Confirmation factors also play a significant role. Validate hammers only when volume exceeds 150% of the 10-period average, signaling robust buying interest [1]. Pairing the hammer pattern with momentum indicators like RSI (to identify oversold conditions) or MACD can further enhance your strategy [3]. Additionally, hammer patterns observed on higher timeframes, such as H1 or above, generally provide more reliable signals than those on lower timeframes [7].
To simplify the process, consider using automation tools to scan multiple assets and apply filters for pattern detection. Before putting real money on the line, backtest your strategy thoroughly using historical data. The key to effectively leveraging the hammer pattern lies in selectivity, combining multiple confirmation factors, and maintaining a disciplined approach. Automation and rigorous backtesting can further strengthen your trading system, creating a solid foundation for consistent results.
FAQs
What’s the difference between a hammer and a hanging man candlestick pattern?
The hammer and hanging man candlestick patterns might look nearly identical, but their meaning changes based on the trend context in which they appear. Both patterns share the same distinctive structure: a small real body positioned near the top of the candle, a long lower shadow that's at least twice the length of the body, and little to no upper shadow.
The critical difference between the two lies in their placement within the trend:
- A hammer appears at the bottom of a downtrend and suggests a potential bullish reversal.
- A hanging man shows up at the top of an uptrend and indicates a possible bearish reversal.
To confirm the validity of these patterns, pay attention to the next candle. For a hammer, watch for an upward price movement, while for a hanging man, look for a downward move. The candle's color can offer additional hints - green often aligns with hammers, and red with hanging men - but the overall trend and context are the key factors in distinguishing between the two patterns.
What are some tools to automatically identify hammer candlestick patterns?
Several tools are available to help traders automate the process of identifying hammer candlestick patterns, making it simpler to spot potential trading opportunities without the need for constant chart monitoring.
Take TradingView, for example. This platform offers Pine Script indicators that can scan charts in real-time and highlight hammer patterns as they appear. If you’re looking for more control, you can even create custom Pine Scripts to define your own criteria, like specific body-to-wick ratios, and apply them across various timeframes. For those who prefer no-code solutions, platforms like TrendSpider let users set up visual rules and send automated alerts whenever a hammer pattern is detected.
On top of that, algorithmic trading frameworks can incorporate the hammer pattern’s distinct features - such as a small upper body and a lower shadow that’s at least twice the size of the body - into automated strategies or backtesting systems. These tools simplify the process, allowing traders to focus their energy on executing strategies rather than manually analyzing charts.
Why is trading volume important when confirming a hammer candlestick pattern?
Trading volume plays a key role in confirming a hammer candlestick pattern, as it helps gauge the strength of the potential reversal signal. When a hammer pattern is paired with high trading volume, it signals stronger market confidence. This suggests buyers are actively stepping in to push back against previous selling pressure.
However, if the hammer forms with low trading volume, the signal tends to be weaker and less dependable. This indicates limited participation from market players, making the reversal less convincing. Always use volume as a supporting factor when interpreting candlestick patterns for a clearer market picture.


