
Spotting Breakouts: Technical Analysis Techniques
Spotting breakouts in trading can lead to substantial gains, but over 50% of initial breakouts fail. To improve your chances, focus on three key tools:
- Bollinger Bands: Identify volatility squeezes as potential breakout signals.
- Moving Averages: Confirm trend direction and momentum.
- Volume Analysis: Validate breakout strength with above-average trading activity.
Combining these methods provides a structured approach to distinguish genuine moves from false signals. For fast execution, tools like TraderVPS ensure minimal delays, allowing you to act on opportunities as they arise. Breakouts require precision, preparation, and the right tools to succeed.
Breakout Pattern Explained - The Perfect Setup
Technical Indicators for Breakout Detection
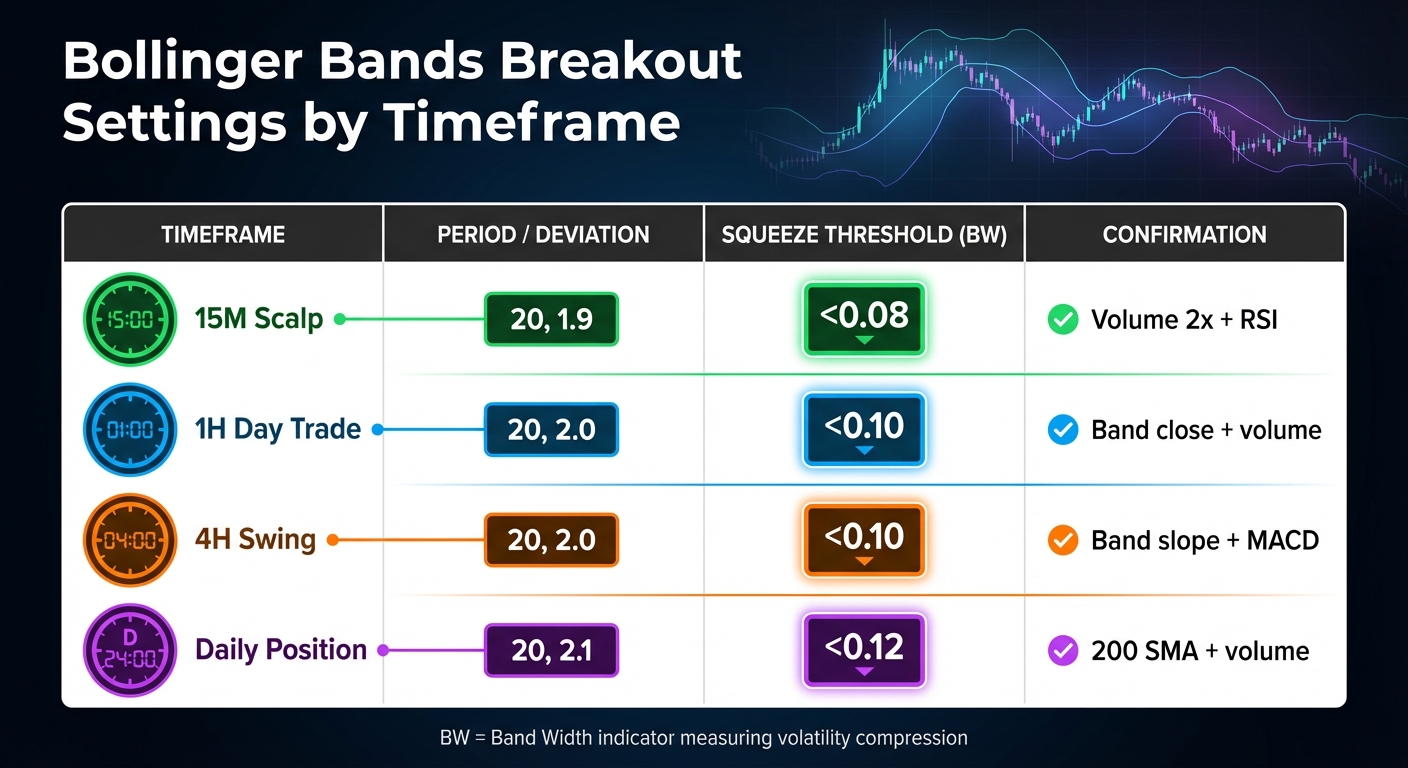
Bollinger Bands Settings and Thresholds for Different Trading Timeframes
Detecting breakouts can feel like a guessing game, but the right technical indicators can transform it into a structured strategy. NinjaTrader offers advanced tools that cut through market noise and help traders zero in on promising setups.
Bollinger Bands for Breakout Signals
Bollinger Bands use statistical methods to identify when markets are gearing up for a move. The setup typically involves a 20-period Simple Moving Average (SMA) as the middle band, with upper and lower bands set two standard deviations away. This configuration captures around 95% of price activity during normal conditions [9].
One key signal is the "volatility squeeze", where the bands compress tightly, signaling low volatility and a potential breakout. NinjaTrader's Market Analyzer tool lets you monitor Bollinger Band values across multiple instruments, making it easier to spot these squeezes [7]. A squeeze is often confirmed when the Band Width (BW) indicator drops to multi-month lows, such as below 0.10 on a 4-hour chart [9][10].
"Consider this as the calm before the storm. As the squeeze plays out, there are often substantial price breakouts above or below the recent prices." - NinjaTrader Team [7]
Take Bitcoin's case in January 2026: a 4-hour Bollinger Band squeeze saw the BW drop to 0.09. After 72 hours of hovering near the middle band, Bitcoin broke above the upper band at $87,200, with a 3x surge in average volume. It reached $91,000, delivering a 4.5% gain [9].
When trading Bollinger Band breakouts, wait for a candle to close decisively outside the bands. A close above the upper band signals bullish momentum, while a close below the lower band indicates bearish pressure [8][9]. To confirm the breakout, look for a volume spike - at least 150% of the 20-period average volume. Without this, 80–85% of breakouts tend to be false [9][1].
| Timeframe | Period / Deviation | Squeeze Threshold (BW) | Confirmation |
|---|---|---|---|
| 15M Scalp | 20, 1.9 | <0.08 | Volume 2x + RSI |
| 1H Day Trade | 20, 2.0 | <0.10 | Band close + volume |
| 4H Swing | 20, 2.0 | <0.10 | Band slope + MACD |
| Daily Position | 20, 2.1 | <0.12 | 200 SMA + volume |
These insights into volatility set the stage for trend confirmation with moving averages.
Moving Averages for Breakout Confirmation
Moving averages help confirm whether a breakout has the backing of a sustainable trend. The 20-period SMA, which also forms the basis of Bollinger Bands, reflects the average price during consolidation [12].
For swing and position trading, longer averages like the 50-period SMA smooth out short-term noise, while the 200-period SMA provides a broader view of long-term trends [12][9]. When prices stay above these averages, it suggests bullish momentum; drops below them indicate bearish conditions.
In trending markets, prices often test the outer Bollinger Bands but revert to the 20-period SMA for potential entries [12]. Pair this behavior with a MACD histogram crossing above the zero line to strengthen bullish signals [11]. Tailor your moving average settings to your trading timeframe, and consider placing stop-loss orders just below the central SMA or breakout level to manage risk effectively [1][12].
Volume Analysis for Breakout Validation
Volume is the secret ingredient that separates real breakouts from fake ones. Without strong volume, a breakout could just be a fleeting price move.
"Volume acts like a magnifying glass for price action. When price bursts through a resistance level, high volume signals strong interest, it's as if you can 'see' traders voting with their capital in real time." - Trade With The Pros [5]
Use a 20-period SMA on volume bars as a benchmark. A valid breakout candle should exceed this average by 150% to 200% [6][1]. Watch for a "volume dry-up" during consolidation phases - this often precedes a sharp move [6][1].
High volume during a breakout confirms robust market interest and increases the likelihood of trend continuation. Conversely, weak volume could signal a lack of conviction and potential reversal [6]. Volume spikes above 200% often indicate institutional activity, which can validate major breakouts [6].
For NinjaTrader users trading futures, calibrate volume calculations to session times (electronic vs. pit hours) to avoid artificial spikes at session boundaries. Combining volume profile analysis with delta divergence and order flow can cut false signals by about 35% and improve trade entry accuracy by up to 20% [4].
Finally, keep an eye on follow-through volume in the candles after the breakout. Sustained high volume signals momentum, while a drop suggests the move could be losing steam [6][1].
When combined with Bollinger Bands and moving averages, volume analysis completes a well-rounded system for spotting actionable breakout opportunities.
Combining Indicators for Accurate Breakout Analysis
Using Bollinger Bands, moving averages, and volume analysis together creates a more precise method for spotting breakouts. While a single indicator can provide some insight, combining signals gives you a broader and clearer view of market conditions.
Here’s how it works: Bollinger Bands highlight the volatility trigger (like a squeeze), moving averages confirm the trend direction, and volume analysis gauges the strength of market participation. Together, they offer a well-rounded perspective on potential breakouts [13][16]. For example, to improve your odds, focus on long breakouts only when the price is above the 50-period SMA. This ensures you’re trading in line with the broader trend rather than against it [15][16].
"The HTF [Higher Timeframe] Basis Line is your trend filter. - Price above HTF Basis = Macro Bullish → Only take BUY signals." - Gold_Trading_Expert, Technical Analyst [15]
The statistics reinforce this approach: breakouts accompanied by volume that’s at least 50% above average have a 65% success rate, while those with below-average volume succeed only 39% of the time [14]. For confirmation, watch for the price to close outside the Bollinger Bands alongside a noticeable spike in volume [6][3]. A real-world example? In September 2023, Tesla (TSLA) consolidated around $250 before breaking out with a 150% volume increase, resulting in a 30% surge in price [14].
Once a breakout is confirmed, it’s wise to validate the move further. For extra caution, wait for the price to retest the breakout level as new support before entering your trade [3]. To manage risk, set your stop loss just inside the opposite Bollinger Band or below the low of the breakout candle [6][2]. This way, you can limit potential losses while positioning yourself for gains.
Using TraderVPS for Breakout Analysis
Spotting breakouts requires precision and speed, and TraderVPS is built to deliver on both fronts. With sub-1 ms latency to major exchanges like the CME Aurora datacenter - compared to the 20–50 ms typical of standard hosting - TraderVPS ensures your orders execute quickly and with minimal slippage during fast market moves [19].
TraderVPS hardware is tailored to meet the specific needs of NinjaTrader users. High-performance AMD EPYC processors handle NinjaTrader's single-core tasks, such as rendering real-time charts and processing advanced indicators like Bollinger Bands and Volume Profiles, with ease [19]. Meanwhile, PCIe Gen 4 NVMe SSDs, capable of read speeds up to 7,000 MB/s, prevent delays when loading years of historical tick data or during intense market activity [19].
"When every tick counts, a VPS tailored for futures trading can mean the difference between slippage and precision." – TradingVPS [17]
With 24/7 uptime, your breakout strategies can run uninterrupted across global trading sessions - even when your local computer is off [18]. This means you can automate NinjaScript strategies to catch breakouts in Asian or European sessions while you sleep. Additionally, the infrastructure supports multi-monitor setups via Remote Desktop Protocol (RDP), enabling you to monitor DOM, tick charts, and order flow simultaneously without lag. Best of all, you can access your trading environment from any device, anywhere, without sacrificing performance.
TraderVPS Plans for Technical Analysis
The right VPS plan depends on how many charts you run and the complexity of your breakout analysis. Here’s a quick comparison of the available options:
| Plan | Core Count | RAM | Storage | Monitors |
|---|---|---|---|---|
| VPS Lite | 4x AMD EPYC | 8GB | 70GB NVMe | None |
| VPS Pro | 6x AMD EPYC | 16GB | 150GB NVMe | Up to 2 |
| VPS Ultra | 24x AMD EPYC | 64GB | 500GB NVMe | Up to 4 |
- VPS Lite ($69/month): Ideal for running 1–2 charts without the need for multi-monitor support.
- VPS Pro ($99/month): Perfect for managing 3–5 charts and supports up to two monitors, making it a great choice for traders handling multiple timeframes.
- VPS Ultra ($199/month): Designed for power users running 5–7 charts, complex strategies, or analyzing several instruments simultaneously. It supports up to four monitors.
Conclusion
Breakouts rely on three key factors: Bollinger Bands for gauging volatility, moving averages for confirming trends, and volume for validating the move. As discussed earlier, a contraction in Bollinger Bands indicates that the market is coiled and ready for a sharp move. When a price closes beyond the bands, coupled with a 150%–200% spike in volume, it’s a strong signal of a genuine breakout rather than a fake one[1]. Moving averages, such as the VWAP or the 20-period SMA, help ensure you’re aligning with the market's momentum instead of trading against it.
"Price alone can lie, but volume usually tells the truth." – Daniel Abramovich, Crypto-Forex Analyst, FXNX[10]
Timing is everything. A slight delay can mean missing the most lucrative part of the move. About 40% of the strongest breakouts don’t retest their breakout levels, meaning if you’re late, the opportunity might be gone entirely[10]. That’s where TraderVPS makes a difference, providing the speed necessary to act when the market moves.
Your success hinges on preparation and execution. A well-optimized VPS setup - whether basic or advanced - ensures you’re ready to seize opportunities as they arise. Breakouts won’t wait, and your trading environment shouldn’t hold you back. Stay ready, trade fast, and let your tools work for you.
FAQs
How do I tell a real breakout from a fakeout?
To spot a real breakout versus a fakeout, pay attention to a few key indicators. A genuine breakout typically shows strong momentum, higher trading volume, a clear close beyond the level, and often a retest that holds firmly as either support or resistance. On the other hand, a fakeout often comes with weak volume, no candle body closing beyond the level, a quick rejection, and a return to the previous range. To strengthen your analysis, look for confluence across multiple timeframes and ensure there’s consistent price movement beyond the level.
What’s the best timeframe for trading breakouts?
The ideal timeframe for trading breakouts typically falls within the short-term to intermediate range, like 5-minute to 1-hour charts. Combining multiple timeframes can enhance precision and reduce the chances of false signals, as it offers a stronger basis for validation.
Where should I place my stop-loss on a breakout trade?
The best place to set a stop-loss for a breakout trade is typically just below the low of the breakout day or near the closest key support level. This placement reflects where buyers entered the market, helping to reduce the chances of getting caught in a false breakout. To manage risk effectively, stick to a consistent method - whether it's based on technical price levels or market volatility.


