
10 Key Systematic Approaches for Day Trading
Day trading thrives on discipline and structured strategies. This article outlines 10 systematic approaches that help traders make clear, rule-based decisions, eliminating emotional pitfalls like fear and greed. These methods are designed to work across various market conditions, focusing on measurable triggers, risk management, and automation.
Key Takeaways:
- Moving Average Crossover Systems: Use short and long moving averages (e.g., 9/21 EMA) to identify momentum shifts, with risk managed by ATR-based stop-losses.
- Intraday Momentum Breakout: Capitalize on price breaking beyond usual ranges, confirmed by volume spikes and ATR thresholds.
- Mean Reversion Systems: Trade price deviations from statistical averages using tools like Bollinger Bands and RSI.
- Trend Following with Price Channels: Identify breakout trends using Donchian or ATR-based channels.
- Volatility Breakout: Trigger trades based on ATR-adjusted levels for range expansions.
- Order Flow Scalping: Analyze real-time liquidity via Depth of Market (DOM) and Time & Sales for short-term trades.
- VWAP-Based Execution: Use VWAP as a dynamic benchmark for entries, exits, and risk management.
- Time-of-Day Patterns: Focus on high-liquidity periods like session overlaps for optimized results.
- Statistical Arbitrage: Exploit mean-reverting relationships between related assets like pairs trading.
- Infrastructure & Risk Management: Emphasize robust systems, automation, and strict risk controls for consistency.
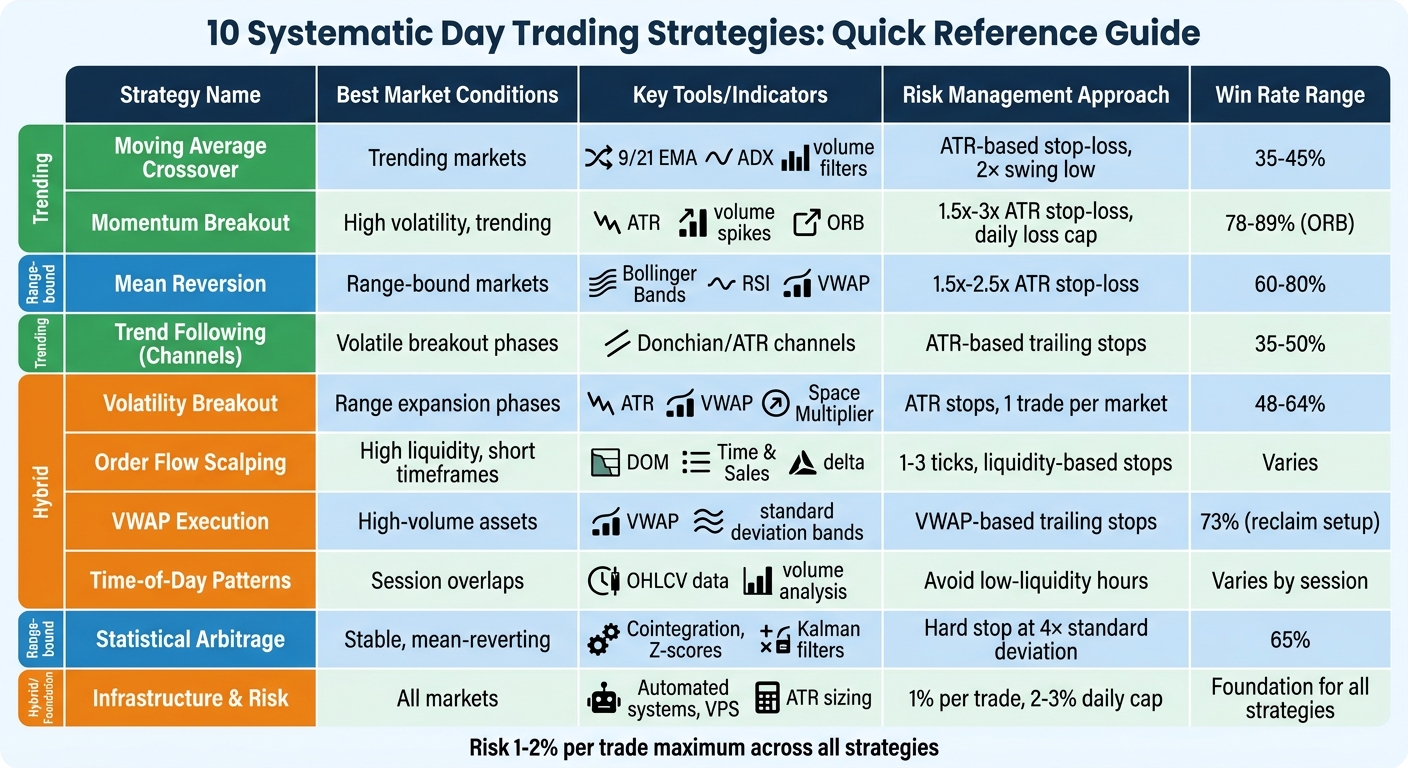
Quick Comparison Table:
| Strategy | Best Market Conditions | Key Tools | Risk Management |
|---|---|---|---|
| Moving Average Crossover | Trending markets | 9/21 EMA, ADX, volume filters | ATR-based stop-loss, 2× swing low |
| Momentum Breakout | High volatility, trending markets | ATR, volume spikes, ORB | 1.5x-3x ATR stop-loss, daily loss cap |
| Mean Reversion | Range-bound markets | Bollinger Bands, RSI, VWAP | 1.5x-2.5x ATR stop-loss, position sizing |
| Trend Following with Channels | Volatile breakout phases | Donchian/ATR channels | ATR-based trailing stops |
| Volatility Breakout | Range expansion phases | ATR, VWAP, Space Multiplier | ATR stops, single trade per market |
| Order Flow Scalping | High liquidity, short timeframes | DOM, Time & Sales, delta analysis | Liquidity-based stops, 1-3 ticks risk |
| VWAP Execution | High-volume assets | VWAP, standard deviation bands | VWAP-based trailing stops |
| Time-of-Day Patterns | Session overlaps | OHLCV data, volume analysis | Avoid low-liquidity hours |
| Statistical Arbitrage | Stable, mean-reverting markets | Cointegration, Z-scores, Kalman filters | Hard stop-loss at 4× standard deviation |
| Infrastructure & Risk Mgmt | All markets | Automated systems, VPS, ATR sizing | 1% risk per trade, daily drawdown cap |
These strategies emphasize predefined rules, automation, and rigorous testing. Whether you're trading breakouts, trends, or mean reversions, success lies in consistency, risk control, and adapting to market conditions.
10 Day Trading Strategies Comparison: Market Conditions, Tools & Risk Management
1. Moving Average Crossover Systems
Quantitative or Algorithmic Basis
A moving average crossover system identifies momentum shifts by observing when a short-period moving average crosses a long-period moving average. For day trading, the 9/21 EMA pair is a common choice because exponential moving averages (EMAs) prioritize recent price data, making them quicker to react to intraday movements. The VibeTrader Team highlights the appeal of this approach:
"Moving average crossovers are arguably the most automation-friendly signal in all of technical analysis." [5]
This simplicity allows traders to implement the system with minimal ongoing adjustments.
Effectiveness in Specific Market Conditions
These systems perform best in trending markets, but they often generate misleading signals in range-bound conditions. For example, a 9/21 EMA crossover typically achieves a win rate of 35–45%, paired with an average win/loss ratio of around 2.0–3.0x. [5] To improve reliability, traders frequently add confirmation tools. Common practices include ensuring the Average Directional Index (ADX) exceeds 20–25 and confirming the signal with a volume surge - such as a volume level reaching at least 120% of its 20-day moving average.
Take Apple as an example: On April 15, 2024, a crossover occurred at $170.15, backed by a significant volume spike. This signal led to a rally, with prices peaking at $180.75 by April 25, delivering a 6.2% gain. [6]
Risk Management and Consistency
Consistency relies on following predefined rules. For instance, only enter trades after the candle has closed, and set a stop loss at 2× ATR below the recent swing low. This approach accommodates normal price fluctuations and reduces the chance of being prematurely stopped out. Macro filters, like requiring the price to be above the 200-day SMA, and adjusting position sizes based on volatility, help maintain consistent risk exposure.
Additionally, factoring in transaction costs is crucial for strategies that may involve 40–80 trades annually. Slippage and commissions can significantly impact net profits, so accurate modeling of these costs is essential. By adhering to these disciplined practices, moving average crossover systems provide a structured foundation for systematic day trading methods, paving the way for the techniques explored in later sections.
2. Intraday Momentum Breakout Methods
Quantitative or Algorithmic Basis
Momentum breakout systems work by identifying when a price moves beyond its usual range. These systems rely heavily on volatility-adjusted entry levels, often calculated using the Average True Range (ATR). A common formula triggers a breakout at the Point of Initiation plus a multiplier of ATR, typically between 1.5x and 3x. This ensures the move is strong enough to cut through normal market noise [9][10]. Volume confirmation is just as important - genuine breakouts usually show volume spikes of 1.5–2x the recent average, signaling interest from institutional players rather than retail-driven false signals [8][4].
For instance, in July 2023, NVIDIA (NVDA) provided a textbook example of this method. A 3% premarket gap set up a momentum breakout. After the market opened, the WaveTrend indicator turned bullish at $450.00, and the "Pace of Tape" showed a surge. Entering at $451.00, with support from an upward-sloping TRAMA (Trend Regularity Adaptive Moving Average), yielded a 4% profit with an exit at $455.00 - all within 45 minutes. The risk on the trade was limited to 0.8%, making for a strong risk-to-reward ratio [7].
This quantitative structure forms the backbone for momentum breakout strategies across different market scenarios.
Effectiveness in Specific Market Conditions
Momentum breakout strategies thrive under certain conditions. Opening-range breakout (ORB) systems, for example, have win rates between 78% and 89%, with profit factors reaching 1.59 [8]. These systems are most effective during high-liquidity periods, like the first 30–60 minutes of the trading session or the final "Power Hour", when both volume and volatility are at their peak [7][4].
Forex traders can also capitalize on specific patterns. For example, GBP/USD typically sees a breakout range of 40–70 pips in the first 90 minutes of the London session. Meanwhile, the EUR/USD 15-minute ORB boasts a 63% continuation success rate [8].
To improve entry precision, traders often use trend strength indicators. The Average Directional Index (ADX) above 25 confirms strong momentum, while an RSI reading above 70 - usually seen as overbought - acts instead as a "dominance signal" during breakouts [8]. A simple filter, like only taking long trades when the price is above the daily open, can weed out up to 80% of noisy entries, reducing false signals without overcomplicating the strategy [9].
Scalability and Execution Speed Requirements
Momentum trading requires quick action because breakout opportunities can fade fast. The 15-minute rule suggests that if a breakout doesn't show price expansion within 12–15 minutes on a 5-minute chart, the momentum is likely stalling and the position should be closed immediately [8]. This time sensitivity makes fast execution crucial. Even a slippage of just 0.5 ticks per side can cut annual returns by around 2.7% [11].
Some traders wait for a breakout level to be retested. If the price holds at that level during the retest, the breakout signal becomes more reliable [8]. As Keenbase Trading puts it:
"Breakout trading isn't about predicting the market; it's about reacting to what price action is telling you in real time." [8]
Risk Management and Consistency
Effective risk management is a cornerstone of successful momentum trading. Position sizing should adapt to market volatility, with stop-loss levels set at 2x to 3x ATR. This approach ensures stops are placed logically, avoiding arbitrary levels that could lead to premature exits [12][9]. Traders are also advised to limit daily losses to 3–5% of account equity and keep the risk per trade between 0.25% and 1% of their total capital [3][11].
To further manage risk, intraday positions should be closed before the session ends (typically by 15:45 ET). This eliminates overnight gap risk, which accounts for about 35% of buy-and-hold drawdowns in major indices [11]. By combining strict volume and volatility filters with disciplined execution, traders can build a repeatable system that minimizes emotional decisions and relies on statistically sound principles.
3. Mean Reversion and Pullback Systems
Quantitative or Algorithmic Basis
Mean reversion systems hinge on the statistical probability that prices stay within two standard deviations of their average about 95% of the time [20]. When prices stray too far from this average, they tend to snap back. Traders use Z-scores to measure how far a price deviates from its historical average, offering clear entry and exit signals based on these deviations [20].
Common tools for this strategy include Bollinger Bands (±2 standard deviations), short-period RSI (values under 30 indicate oversold conditions, while over 70 suggests overbought), and VWAP for intraday trading [16][17][20]. VWAP serves as a "fair value" benchmark, with price movements of 0.5%–0.7% away from it often signaling a potential reversal [13][16].
"Mean reversion is the empirical tendency of asset prices, valuations, and spreads to gravitate back toward their long-run averages over time." [15]
Effectiveness in Specific Market Conditions
Mean reversion systems thrive in stable, range-bound markets, unlike momentum strategies that perform better in trending conditions. These strategies focus on predictable oscillations and often complement approaches like moving averages or momentum breakouts. Markets exhibit mean-reverting behavior approximately 60–70% of the time, while the remaining 30–40% consists of trending phases that can erase gains if not managed carefully [18]. The win rates for mean reversion strategies generally range between 60% and 80%, though individual trade profits are typically smaller compared to momentum-based systems [16][19].
A key tool for identifying suitable conditions is the Average Directional Index (ADX). A reading below 25 helps confirm a range-bound market rather than a trending one [18]. For example, during the 2008 Global Financial Crisis, a market-neutral mean reversion system experienced a 14.8% loss, faring much better than the S&P 500's 37% decline, showcasing its resilience in volatile recovery periods [15]. However, in strong bull markets like 2013–2016, a simulated equity mean reversion strategy returned only 4.1% annually, falling far short of the benchmark's 11.2% [15].
Risk Management and Consistency
Mean reversion systems demand a different approach to risk management compared to trending strategies. Effective execution requires volatility-adjusted position sizing, with risk per trade limited to 1–2% of total capital. Position sizes should scale inversely with the Average True Range (ATR) [20][22]. Stop losses are typically set at 1.5 to 2.5 times ATR, depending on current volatility levels [20]. During periods of heightened volatility - when the VIX exceeds the 70th–80th percentile - reduce position sizes by 30–50%, as mean reversion strategies often falter during sharp market swings [18].
To improve reliability, avoid fading a move unless price action confirms it through signals like long wicks, engulfing candles, or volume spikes near key deviation levels [14][16]. Exits are generally triggered when the price returns to the mean (0 standard deviations) or after a set time frame, usually 3–10 days, if the reversion doesn't occur [18]. To prevent significant losses during market-wide shifts, keep total open risk across all positions below 6–8% of account equity [18]. Additionally, pause mean reversion systems during high-impact events like FOMC or CPI announcements, as these can cause structural changes that invalidate the assumed "mean" [14][21].
4. Intraday Trend Following with Price Channels
Quantitative or Algorithmic Basis
Intraday trend following with price channels provides traders with clear, measurable signals for making disciplined decisions. These channels establish boundaries: breaking above the upper band signals strong buying, while dropping below the lower band points to selling pressure [24]. Two common methods for defining these channels are Donchian Channels, which use the highest high and lowest low over a rolling period, and Dynamic ATR Channels, which adjust a moving average by a multiple of the Average True Range (ATR) to account for current market volatility [23][24][26].
A four-year backtest of EURUSD 1-minute data (2020–2025) highlighted the potential of this approach. Trader Gamuchirai Ndawana implemented a "4-Zone" dynamic channel strategy, which used a 20-period Daily Moving Average and ATR to distinguish trend zones from range zones. This method boosted the win rate from 52% to 86% by avoiding long trades in bearish zones [26]. Such a structured, data-driven approach offers valuable insights into market behavior under varying conditions.
Effectiveness in Specific Market Conditions
Price channels shine during periods of volatile breakouts and steady trends. They are particularly effective when markets shift from low-volatility ranges to high-momentum movements - commonly called the "compression to expansion" phase [24]. During sustained trends, prices often hover near the outer bands, making these systems highly effective. However, in range-bound markets, minor price extremes without follow-through can result in false signals or "whipsaws" [24].
For instance, a backtest of EURUSD 1-hour intervals (2018–2022) achieved a 65% win rate for channel breakouts when combined with volume and RSI confirmations [25]. Typically, traders use a 20-period lookback for intraday breakouts and a 55-period lookback for longer-term trends [24]. To reduce noise, it’s recommended to wait for breakouts that close in the outer third of the channel, supported by volume that is 1.5× to 2.0× the recent average [24][27].
Scalability and Execution Speed Requirements
Intraday channel strategies require quick responses due to their reliance on short timeframes. Scalpers often use 1–5 minute charts, while swing traders may focus on 1-hour to 4-hour intervals [25]. Speed is critical; delays in execution can erode profitability, especially during fast-moving trends [27]. To address this, traders frequently rely on automated scripts (e.g., Pine Script or MQL5) to generate real-time alerts and execute trades when prices breach or close beyond a channel boundary [25][26].
The first trading hour often offers the best opportunities due to peak liquidity [27]. While waiting for a bar to close before entering can reduce false signals, it may result in slightly later entries [24].
Risk Management and Consistency
Managing risk is essential when using channel-based systems. Position sizes should be inversely proportional to channel width, while stop-losses can be set at the opposite channel boundary, a recent swing low or high, or using an ATR-based trailing stop (1.5× to 2.0× ATR) [24][25][27]. Even with win rates as low as 35–50%, profitability can be achieved through favorable risk-reward ratios, typically 2:1 or 3:1 [27].
"Risk management is more important than strategy selection - never risk more than 1-2% of your account on a single trade." – Finwiz.io [4]
To avoid false signals in choppy markets, it’s best to activate the strategy only when the ATR exceeds a predefined threshold [28]. Consistency can also be improved by aligning trades across multiple timeframes - e.g., taking intraday long trades only when the higher timeframe (such as the Daily chart) is trending upward [25]. A backtested strategy combining Keltner Channels with ATR filters achieved a Sharpe Ratio of 3.82 and a Profit Factor of 1.27 [28].
5. Volatility Breakout and Range Expansion
Quantitative or Algorithmic Basis
Volatility breakout strategies rely on a straightforward formula: Point of Initiation + (Space Multiplier × ATR). The Point of Initiation acts as a reference price, which could be today's opening price, yesterday's closing price, a moving average, or the Volume Weighted Average Price (VWAP). The Space Multiplier sets the distance the price must move from this reference point to trigger a trade, using the Average True Range (ATR) to account for current market volatility [9].
"Calculate the breakout level as: Point of Initiation + (Space Multiplier × ATR). When price crosses above that level (for longs) or below it (for shorts), the strategy enters." – Breakout Trading Academy [9]
Some advanced systems integrate the Variance Risk Premium (VRP), which leverages the tendency for implied volatility to overestimate realized volatility roughly 85% of the time. For the S&P 500, this premium frequently ranges between 2 and 4 volatility points [30]. Additionally, tools like "Concretum Bands" are used to establish a volatility-adjusted "Noise Area" around the previous day's close or the current day's open. Entries are triggered only when the price moves decisively beyond these zones [31]. Many models also restrict trading to the first 15–30 minutes of the session, a period known for its high institutional liquidity [49,53].
This precise approach allows traders to adapt their strategies to changing market dynamics.
Effectiveness in Specific Market Conditions
Volatility breakout strategies tend to thrive in trending markets and during periods of range expansion. These strategies are particularly effective when markets transition from low volatility to high momentum. For instance, a study of Indian markets over a decade revealed that about 64% of Nifty and 70% of Bank Nifty trading days reached their daily high or low within the first hour of trading [29]. A backtest of a simple Opening Range Breakout (ORB) strategy on Bank Nifty showed a 48% win rate. Despite this modest success rate, the strategy remained profitable due to its favorable risk-to-reward ratio [29].
However, in range-bound or low-volatility conditions, these strategies often struggle with false breakouts and frequent reversals. Trading in such environments can lead to losses as transaction costs and slippage eat into small gains [10]. Adding a market-context filter - such as identifying "narrow days" or periods of volatility contraction - can improve results. One study found that applying such a filter tripled the average trade expectancy while reducing the number of trades by a factor of six [10]. To further refine results, traders often align breakout trades with higher timeframe trends and use VWAP as a directional filter: taking long trades only when the price is above VWAP and shorts when it is below [49,7].
Scalability and Execution Speed Requirements
Speed is critical for these strategies due to their reliance on precise price movements. Fast platforms and accurate data are essential for managing rapid entries and exits [53,22]. Using a zero-parameter intraday trend direction filter can eliminate up to 80% of false signals [9]. A simple adjustment, such as only taking long trades when the price is above the daily open, can significantly enhance performance - improving the profit-to-drawdown ratio from 5.24 to nearly 8 [9].
Different timeframes for ORB strategies cater to varying trading styles. A 5-minute ORB generates frequent signals but with lower reliability, making it suitable for scalpers using tight stops. A 15-minute ORB balances signal frequency with reliability, appealing to many day traders. Meanwhile, a 30-minute ORB produces fewer but more dependable signals due to wider stops and reduced noise [49,7].
Risk Management and Consistency
As with any systematic approach, disciplined risk management is key to maintaining consistency. Effective risk controls in volatility breakout strategies involve using ATR-based stops rather than fixed point values to adjust for market conditions [53,22]. Limit risk to 1–2% of capital per trade. For example, a live intraday breakout system operating since May 2023 reported an average margin allocation of just 16.5% of total capital [51,53,7].
To optimize performance, focus on trading during high-liquidity periods, such as the first few hours of the session, and avoid entries after 12:00 PM ET when the strategy's edge typically diminishes [29]. Close all positions by the end of the trading day to avoid overnight risks [51,21]. Limit yourself to one breakout trade per market per day [22,49]. For added confirmation, wait for a pullback to the breakout level, which helps establish support or resistance and improves the trade's risk-to-reward ratio [29].
6. Intraday Scalping with Order Flow
Quantitative or Algorithmic Basis
Order flow scalping zeroes in on real-time liquidity changes to seize short-term trading opportunities. Like other systematic trading methods, it relies on measurable signals to reduce emotional decision-making.
This strategy revolves around analyzing two key tools: Depth of Market (DOM) and Time & Sales (the tape). The DOM displays pending limit orders, while the tape shows completed trades. A critical metric here is delta, which tracks the net difference between aggressive buyers and sellers at each price level. For instance, if the price hits a new high but cumulative delta shows a lower high, it may indicate that aggressive buyers are losing momentum.
Another important concept is absorption. This happens when large resting limit orders soak up aggressive market orders without letting the price move, hinting at a potential reversal. Traders also watch for liquidity vacuums - areas with few resting orders - where prices can move quickly due to minimal resistance. Additionally, a market order imbalance becomes noteworthy when over 70% of the executed volume within a price range comes from one side. To visualize this, traders often use Footprint Charts, which display volume at every price tick. [32][33][34][35][37]
Effectiveness in Specific Market Conditions
Order flow scalping thrives during high-liquidity times, such as the New York Open (9:30–11:00 AM ET), when institutional trading activity peaks. It's crucial to act only on clear DOM signals. For liquid instruments like BTC/USDT perpetual contracts, order flow signals can lead price action by 2 to 15 seconds.
One popular tactic is the "First Test" rule, which involves trading the first return to a Heavy Volume Zone (HVZ) after a breakout. However, this strategy can falter during major economic events like CPI or FOMC announcements, as rapid order book clearing reduces reliability. Similarly, in less liquid markets, such as smaller crypto pairs, slippage and higher execution costs can eat into the slim margins that scalping aims to capture. [33][34]
Scalability and Execution Speed Requirements
Speed is everything in order flow scalping. Tools like Direct Market Access (DMA) and hotkeys are essential, as even a one-second delay can negate the edge. Slow data feeds or execution pipelines can render signals useless, making real-time WebSocket feeds critical for DOM updates. Many traders now use institutional-grade mobile platforms to execute trades on the go.
A helpful technique is iceberg detection, where traders monitor price levels that refill at least three times within 200 milliseconds after depletion. This can reveal hidden institutional orders. Additionally, frameworks like the "Decision Triad" guide entries by combining insights from the Order Book, the Tape, and Price Action. To master this method, traders typically spend 4–6 months practicing in simulation to differentiate meaningful liquidity patterns from market noise. [32][33][36]
Risk Management and Consistency
Risk management in order flow scalping prioritizes liquidity-based stop placements over fixed-percentage stops. Stops are set just outside key bid/ask levels on the DOM, and trades are exited immediately if the price doesn't move as expected within a few seconds or 2–3 candles. Losses are kept to 1–3 ticks per trade, with a risk of only 0.5%–1% per trade and a daily loss cap of 2%.
A reward-to-risk ratio of at least 2:1 is a common target. Monitoring cumulative delta for divergences - like when prices reach new highs but aggressive buying volume declines - can signal potential reversals. To prevent overtrading, traders limit themselves to 1–3 trades during high-volume periods, often referred to as "Kill Zones." [32][36][37][38]
This detailed approach to order flow scalping adds depth to systematic trading by focusing on the intricacies of intraday market liquidity.
7. VWAP and Liquidity-Based Execution
Quantitative or Algorithmic Basis
VWAP, or Volume-Weighted Average Price, represents the session's average price weighted by trading volume. It's calculated by dividing the cumulative product of the typical price and volume by the cumulative volume [39]. Unlike simple moving averages, VWAP gives more importance to prices with higher trading activity [42].
Institutional traders often aim to execute buy orders at or below VWAP and sell orders above it. This practice creates natural buying and selling pressure around the VWAP line, reinforcing its importance as a liquidity marker. As GrandAlgo puts it:
"VWAP is not just another line. It is the benchmark against which billions of dollars in institutional order flow are measured every single session." [41]
Traders also use standard deviation bands (e.g., ±1σ, ±2σ) around VWAP to identify overextension. These bands encompass about 68% and 95% of price data, respectively [41]. In liquid markets, large-cap stocks often revert when prices deviate by 2% from VWAP, while mid-cap stocks may reverse around a 1.5% deviation [40]. These characteristics make VWAP a key tool for navigating different market conditions.
Effectiveness in Specific Market Conditions
VWAP's effectiveness depends heavily on the prevailing market environment. In range-bound or balanced sessions, VWAP acts as a central point, with prices frequently crossing it as institutional algorithms aim to align execution with the benchmark [41]. This creates opportunities for mean reversion trades.
During strong trending markets, however, VWAP often functions as dynamic support or resistance. Prices may "walk" along the first standard deviation band instead of reverting to the mean [41]. Christopher Downie, Content & Product Strategist at LuxAlgo, emphasizes the role of trading volume:
"Volume is crucial for VWAP strategies as it directly influences the indicator's calculation. High volume can make VWAP more reliable, while low volume can make it less reliable." [40]
Two common setups include the VWAP Pullback - buying on the first or second touch of VWAP during an uptrend - and the VWAP Reclaim, where prices reclaim the VWAP line on high volume after spending over two hours below it. The latter setup has a 73% chance of closing the session above VWAP [43]. To improve reliability, traders should avoid VWAP signals during the first 15–30 minutes of trading, as this period tends to be volatile. Signal accuracy generally improves after 10:00 AM ET [43].
Scalability and Execution Speed Requirements
VWAP strategies work best with high-volume assets like large-cap stocks or major ETFs (e.g., SPY, QQQ) [39]. Institutional algorithms often split large orders into smaller "child orders" to match expected trading volumes, minimizing market impact [44]. These systems rely on Smart Order Routing (SOR) to connect with multiple venues and dark pools, ensuring optimal pricing [44].
Retail traders can also deploy VWAP-based systems by leveraging high-performance tools like kdb+ or OneTick for managing real-time data. Python libraries such as PyAlgoTrade, QSTrader, and QuantConnect offer robust platforms for developing and backtesting these strategies. For consistent automated execution, services like TraderVPS provide low-latency infrastructure and round-the-clock uptime.
Risk Management and Consistency
VWAP itself can serve as a dynamic trailing stop-loss. For example, if the price closes decisively on the opposite side of the VWAP line, it signals that the trade's premise is no longer valid [41]. ChartingLens explains:
"When a buy order is executed below VWAP, the algorithm considers that good execution. If a buy order ends up above VWAP, that's considered underperformance." [39]
To improve consistency, traders should confirm VWAP-based entries with additional signals, such as volume spikes or candlestick patterns like hammers or pin bars [39]. Automated alerts - such as "Price closed above VWAP on 5-minute chart with RSI < 70" - can also help maintain discipline and reduce emotional decisions. Adjusting standard deviation bands for specific sectors can further fine-tune performance. For instance, widening bands to 1.5 in volatile sectors like Technology (QQQ) or narrowing them to 0.75 in stable sectors like Financials (XLF) can improve strategy alignment [43].
8. Time-of-Day and Session-Based Patterns
Quantitative or Algorithmic Basis
Time-of-Day (ToD) filters help traders identify the best moments to act without altering the core logic of their trading systems. By analyzing hourly OHLCV (Open, High, Low, Close, Volume) data, these filters uncover patterns in institutional activity, volume surges, and market volatility. The goal? Pinpoint when signals are most effective.
Traders often rely on conditional return spreads, which measure average returns following significant prior moves (above the 75th percentile). For a session-based edge to be worth trading, the return spread needs to cover at least three times the transaction costs. For example, Ethereum (ETH) shows a spread of 44.9 basis points compared to 7 basis points in costs - an efficient 6.4× ratio. On the other hand, Bitcoin (BTC) has a spread of 13 basis points, which only translates to about 1.9× the costs, making it less appealing [46].
To keep up with changing market conditions, walk-forward optimization is used to recalibrate trading windows based on recent data. This ensures the ToD filter remains relevant, identifying sessions that consistently deliver the strongest edge.
Effectiveness in Specific Market Conditions
Certain trading windows stand out for their liquidity and opportunity. The overlap between the London and New York sessions (8:00 AM to 12:00 PM ET) accounts for a staggering 60% of daily forex trading volume, making it a prime time for momentum and breakout strategies [48]. In contrast, the Asian session (7:00 PM to 3:00 AM ET) generally sees lower trading volume and narrower price ranges, which are better suited for mean reversion strategies.
In one study by the QuantStrategy.io Team, focusing an S&P 500 futures mean-reversion strategy on the 9:30 AM to 11:00 AM ET window boosted the Profit Factor from 1.15 to 1.75 while cutting the maximum drawdown nearly in half. Meanwhile, the midday period (11:30 AM to 3:00 PM ET) caused 60% of total maximum drawdown despite representing only 8–12% of daily trading volume [45][50]. As Forex educator Elena Vasquez explains:
"If you are applying a breakout strategy during a liquidity drought, your edge evaporates regardless of how perfect your technical analysis is." [47]
Cryptocurrency markets add another layer of complexity. Unlike equities, which often show reversals between trading periods, cryptocurrencies tend to exhibit momentum that carries across sessions. For instance, strength during the European session (8:00 AM to 4:00 PM UTC) frequently extends into the U.S. session. Take ETH as an example: a Europe-to-U.S. momentum strategy delivered a net return of +256% over 4.7 years (May 2020 to February 2026) with a Sharpe Ratio of 0.808 [46].
To take full advantage of these high-liquidity periods, traders need fast and efficient execution systems.
Scalability and Execution Speed Requirements
Session-based strategies thrive with high-volume assets like major ETFs (e.g., SPY, QQQ) or liquid forex pairs (e.g., EUR/USD, GBP/USD). For example, the equity market's opening hour (9:30 AM to 10:30 AM ET) captures 22–25% of daily trading volume. During this time, SPY's hourly price range averages 0.72%, compared to just 0.22% during the lunch hour [50]. This concentrated activity allows algorithms to handle larger orders with minimal market disruption.
However, to make the most of these short, high-liquidity windows, traders need low-latency systems that can execute orders quickly and efficiently.
Risk Management and Consistency
Adjusting strategies based on session timing helps traders maintain discipline and improve performance. For instance, identifying and avoiding "losing hours" can increase monthly profits by 20–40% [49]. Similarly, reducing position sizes by 25–50% during the lunch window (11:30 AM to 1:00 PM ET) can help mitigate the effects of wider bid-ask spreads and higher slippage [50].
Additionally, implementing a "Flat" Rule for major news events - stepping out of the market at least five minutes before and after Tier 1 economic releases (like CPI or FOMC announcements) - can protect against unpredictable price spikes [49]. Forex traders should also steer clear of the "rollover trap", avoiding new trades between 4:55 PM and 6:00 PM NY time when liquidity drops and spreads can widen by 10 to 25 pips [47].
Modern proprietary trading firms have flagged inconsistent behaviors, such as relying on low-liquidity, news-driven spikes for the majority of profits. These practices often signal a lack of systematic discipline [47].
9. Statistical Arbitrage and Pairs Trading
Quantitative or Algorithmic Basis
Statistical arbitrage, or "stat arb", takes a unique approach by focusing on the relationships between assets rather than market direction. This market-neutral strategy capitalizes on short-term price discrepancies between related securities, assuming these differences will revert to historical norms over time [51][54]. Unlike directional trading, which bets on price movement, stat arb zeroes in on how assets interact.
In the futures market, stat arb typically manifests in three ways:
- Calendar spreads: Exploiting price differences between futures contracts with varying expiration dates (e.g., June vs. September crude oil).
- Inter-commodity spreads: Trading related assets that often move in tandem, like crude oil versus heating oil or corn versus wheat.
- Basis arbitrage: Targeting the gap between an asset's spot price and its futures price, a method also popular in cryptocurrency markets with perpetual swaps [53][54].
The backbone of this strategy lies in advanced statistical models. Instead of relying on basic correlation, traders use cointegration tests, such as the Engle-Granger or Johansen methods, to verify that the price spread between two assets is statistically mean-reverting [51][52]. A hedge ratio (β) is calculated using linear regression to determine position sizes, defining the spread as Price_A minus (β × Price_B) [51]. More advanced setups might include Kalman filters, which adjust the hedge ratio dynamically, enhancing the spread's stability [51][55]. Entry points are often based on Z-scores exceeding ±2.0 standard deviations, with exits triggered when the spread reverts to zero [51][52]. This structured approach ensures that the strategy adapts to changing market dynamics.
Effectiveness in Specific Market Conditions
Stat arb thrives in markets where pricing relationships are stable and mean-reverting. A well-known study by Gatev, Goetzmann, and Rouwenhorst revealed that a distance-based pairs trading strategy yielded about 11% annualized returns from 1962 to 2002, with a 65% success rate for identified pairs [51]. However, since 2010, increased competition from high-frequency trading firms has compressed returns to just 3–5% annually [51].
The strategy isn’t without its challenges. During the "Quant Meltdown" of August 2007, simple mean-reversion approaches suffered significant losses, with some strategies losing 25% of their value in just four days due to rapid sell-offs. The Goldman Sachs Global Alpha fund reportedly lost 30% of its value during this period, as overlapping positions worsened liquidity issues [51][56]. As Khandani and Lo observed:
"the apparent diversification of trading many independent pairs was illusory" [51]
Scalability and Execution Speed Requirements
In electronic markets, price discrepancies can vanish within seconds, making speed crucial for stat arb. High-frequency execution and low-latency infrastructure are essential, as transaction costs (20–50 basis points) can eat up as much as 75% of the expected 0.8% profit [51][54].
Modern stat arb relies on cutting-edge technology. Cloud-based systems now enable smaller firms to access the necessary infrastructure, while machine learning techniques like clustering help identify less obvious asset pairs across sectors [51][54]. The need for quick and efficient execution highlights the importance of robust systems that can handle rapid market changes.
Risk Management and Consistency
Effective risk management is non-negotiable in stat arb. Traders often set hard stop-losses when a spread diverges beyond 4.0 standard deviations, as this could indicate a breakdown in the historical relationship [51]. For equity pairs, keeping an eye on borrow costs is equally important, as rising rates during market stress can erode profits [51]. Position limits and monitoring bid-ask spreads further help mitigate risks during volatile conditions [54].
For example, a backtested PARA/SPOT pairs strategy achieved a Sharpe ratio of around 2.0 with a maximum drawdown of just 0.22% [52]. To avoid overfitting, traders typically test strategies on historical data, then validate them on a separate dataset to ensure stability before live trading [55]. However, academic studies suggest that once a profitable strategy becomes widely known, its returns can drop by over 25% as more traders target the same opportunity [51]. This highlights the importance of constant refinement and adaptability in stat arb.
10. Infrastructure and Risk Management for Systematic Trading
Scalability and Execution Speed Requirements
The leap from running strategies on a local PC to leveraging professional-grade infrastructure is a critical step in systematic trading. This often involves choosing between Windows vs Linux VPS environments based on strategy requirements. Systematic strategies now dominate the landscape, accounting for 80% of U.S. stock market trading volume, while automated systems handle over 70% of global equity trades [59][1]. In this highly competitive environment, where trades are executed in sub-millisecond windows, relying on a standard home internet connection can leave traders at a serious disadvantage.
For example, a typical home fiber connection in New Jersey averages a 62ms ping to brokers, with 11 order errors per 100 trades and 0.8 pip slippage on EUR/USD trades. Compare that to a Virtual Private Server (VPS) providers hosted in NY4, which can achieve a 0.8ms ping, 0–1 errors per 100 trades, and 0.1 pip slippage [1]. This stark difference highlights the importance of robust infrastructure, not just for speed but also for embedding precise risk controls and enabling real-time automated monitoring.
Risk Management and Consistency
Even the best infrastructure is meaningless without strong risk management. Studies show that 90% of trading success hinges on risk management rather than clever entry signals [59]. Yet, 75% of traders fail within their first two years, often due to inadequate governance rather than poor strategy ideas [59].
Effective risk management starts with integrating controls directly into the execution layer. Key safeguards include position size caps, sector exposure limits, and daily drawdown breakers to halt trading if losses exceed 2% of capital [57][59]. One foundational rule, the 1% rule, ensures that no single trade risks more than 1% of total account equity [3][4]. Automated systems can enforce this by using ATR-based position sizing, which adjusts trade sizes to account for varying instrument volatility, reducing the need for manual oversight [3][60].
Michael Brenndoerfer, a Quantitative Finance Researcher, emphasizes the importance of simplicity in trading systems:
"A well-executed process on a simple idea will always outperform a sloppy process on a clever one" [1].
This principle underscores why streamlined strategies often outperform overly complex ones. For example, a system with just two parameters is far less prone to failure than one overloaded with ten [58].
Institutional-grade frameworks often include advanced tools like real-time Value at Risk (VaR) monitoring and stress testing against historical market scenarios [2][59]. Retail traders can adopt similar practices by using staging environments to simulate historical trade fills, ensuring execution logic is sound before going live [59]. Additional safeguards, such as automated heartbeat signals to verify algorithm activity and one-click rollback features for quick error recovery, are vital for protecting capital during volatile market conditions [59].
The Shift to Systematic Trading - Building Backtested Confidence · Dave Mabe
Conclusion
Day trading thrives on discipline and consistency, turning what could be a chaotic endeavor into a structured, repeatable process. Success doesn’t hinge on uncovering the perfect entry signal - it’s about sticking to a well-researched framework and executing it with precision. Research indicates that effective risk management accounts for up to 90% of trading success, yet 75% of traders fail within their first two years, often due to a lack of discipline and strategy [59].
The ten approaches outlined earlier focus on replacing emotional decision-making with clear, measurable rules. Whether you’re using moving average crossovers or statistical arbitrage, the strength of these strategies lies in their repeatability. For instance, with a 1:2 risk-reward ratio, you only need to win 34% of trades to achieve profitability [3].
Risk management is the backbone of any systematic trading strategy. Before committing real capital, test each method thoroughly - aim for 50 to 100 trades to validate its consistency [4][1]. Use simulated environments to fine-tune execution and save a portion of historical data for out-of-sample testing. Remember, theoretical profits can shrink when realistic factors like transaction costs, commissions, and slippage are accounted for [2][1].
Stick to the golden rules: risk no more than 1–2% of your account equity on a single trade [4][3], and set a daily loss cap of 2–3% of your total capital [3][4]. These safeguards are crucial for long-term survival. As Daniel Harrington, Senior Trading Analyst, points out:
"A surprising number of traders blow accounts not from bad entries, but from bad sizing on good setups that just didn't work that day" [3].
Additionally, using professional-grade execution tools can drastically reduce order errors, bolstering the reliability needed to grow your account over time [1].
From rule-based entries to rigorous risk controls, systematic trading offers a clear path to mitigate emotional pitfalls. Choose one or two strategies that align with your trading style, test them thoroughly, enforce strict risk measures, and execute with unwavering discipline. In today’s market, where systematic methods dominate, the real challenge isn’t deciding whether to adopt these approaches - it’s how quickly you can implement them effectively.
FAQs
Which strategy fits my market and style?
The right trading strategy for you hinges on your personal preferences, risk appetite, and the types of instruments you trade. If you're into active, short-term trading, strategies like momentum trading or breakout trading might be a good fit. These approaches focus on capturing quick price movements and rely on clear, actionable signals.
On the other hand, if you lean toward systematic, rule-based methods, you might explore algorithmic trading or statistical arbitrage. These strategies use data-driven models and automation to make decisions, which can be ideal if you have the right tools and technical expertise.
Ultimately, your strategy should match your experience level, the tools you have access to, and your approach to managing risk.
How do I backtest without overfitting?
To prevent overfitting during backtesting, stick to clear and precise entry and exit rules. Use robust validation methods like walk-forward analysis or Monte Carlo simulations to test your strategy's reliability. Factor in realistic trading costs, as ignoring these can skew results. Avoid over-optimizing by limiting excessive parameter adjustments, and consider applying time-series validation for cross-checking performance.
Additionally, focus on strategies that show consistent results across various datasets and market conditions. These steps help ensure your strategy isn't just tailored to past data but is prepared to handle the unpredictability of live trading.
What tools do I need to automate safely?
To trade automatically without compromising safety, you’ll need a few essential tools. Here’s what should be in your toolkit:
- Reliable VPS: A virtual private server guarantees low-latency connections and uninterrupted execution, which is crucial for automated trades.
- Trading Platform: Choose one that supports automation and allows you to backtest strategies effectively.
- Real-Time Data Feeds: Accurate and up-to-date data is a must for making informed trading decisions.
- Risk Management Tools: Features like stop-loss orders and metrics such as drawdown help keep your risks in check.
- Backtesting Tools: These let you test your strategies on historical data, helping you refine and reduce potential risks.
With these tools in place, you’ll have the foundation for safe and efficient automated trading.


