
Minervini Method: Stepwise Approach to Winning Stocks
The Minervini Method is a stock trading strategy designed to identify and profit from high-growth stocks. Created by Mark Minervini, a U.S. Investing Champion, this method focuses on finding stocks in strong uptrends (Stage 2) with clear institutional support. It combines technical analysis, fundamental metrics, and strict risk management to maximize returns while minimizing losses.
Key highlights include:
- Trend Template: Filters stocks based on eight technical criteria, such as moving averages and proximity to 52-week highs, to confirm uptrends.
- Volatility Contraction Patterns (VCPs): Identifies entry points where selling pressure has decreased, signaling a potential breakout.
- SEPA (Specific Entry Point Analysis): Aligns technical patterns with fundamentals like earnings growth (20%+), revenue growth (15%+), and institutional ownership (30%-70%).
- Risk Management: Limits risk to 1%-2% per trade, with stop-losses set 7%-8% below entry price. Gradual portfolio exposure is built based on trade performance.
This disciplined approach emphasizes timing, quality setups, and protecting capital. Tools like TraderVPS can enhance execution reliability for traders using this method.
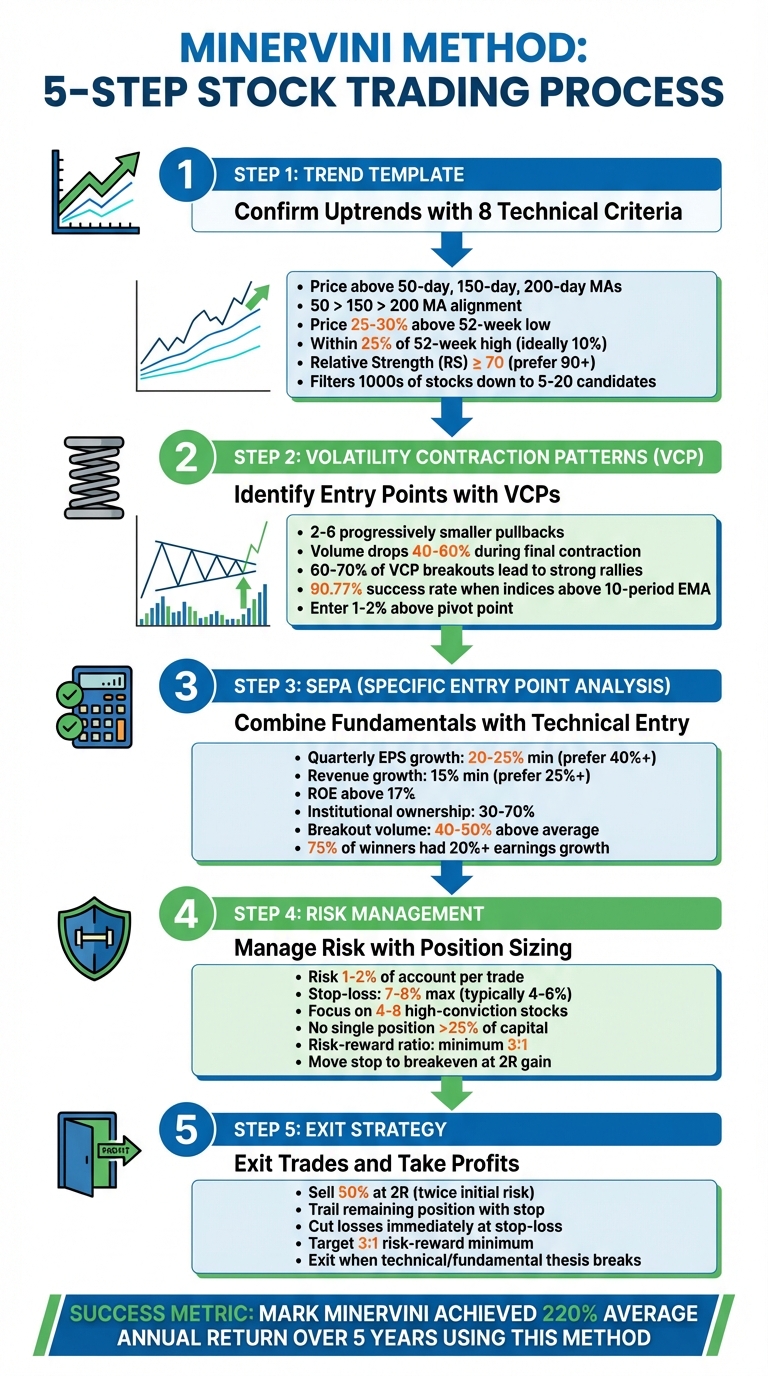
Minervini Method 5-Step Stock Trading Process
Mark Minervini Profitable Trading Strategy Complete Tutorial - Part #1 SEPA SYSTEM Risk Management
Step 1: Use the Trend Template to Confirm Uptrends
The Minervini Method starts with the Trend Template, a tool designed to identify stocks with the potential for strong upward momentum. This filter applies eight technical criteria that must all be met simultaneously. If even one criterion is missing, the stock is excluded.
This rigorous process narrows down thousands of stocks to just 5–20 high-potential candidates [1]. The focus is on identifying stocks in "Stage 2", the phase where institutional buying drives significant price increases. Historical data shows that nearly all top-performing stocks trade above their 200-day and 50-day moving averages before making major gains [6].
Technical Requirements for the Trend Template
The Trend Template relies on specific alignments of moving averages and price levels:
- The stock price must trade above the 50-day, 150-day, and 200-day moving averages.
- The 150-day moving average must sit above the 200-day moving average to confirm intermediate momentum.
- The 50-day moving average must also be above both the 150-day and 200-day moving averages, with the stock price itself above the 50-day moving average.
This alignment of 50 > 150 > 200 indicates sustained institutional buying over time [1]. Additionally, the 200-day moving average must be trending upward for at least one month, though a trend of four to five months is preferred.
Price levels relative to 52-week highs and lows are also key. The stock price should be at least 25% to 30% above its 52-week low and within 25% of its 52-week high. Ideally, stocks closer to new highs - within 10% of their 52-week peak - are considered strong leaders. Conversely, stocks trading 40–50% below their highs are often lagging.
For example, Kyndryl Holdings Inc (KD) demonstrated all the required traits. It traded at $34.83, above its 50-day ($30.12), 150-day ($26.53), and 200-day ($25.52) moving averages. The moving averages were perfectly aligned, the price was 78% above its 52-week low, and it was within 4.5% of its 52-week high. Its Relative Strength (RS) was an impressive 94 [7]. This showcases how following the Trend Template can pinpoint genuine market leaders.
In contrast, Infosys in December 2022 failed the Trend Template. Despite some momentum and trading above its 50-day moving average, its 50-day and 150-day moving averages were still below the 200-day moving average. This indicated it had not yet entered a confirmed Stage 2 uptrend [8].
Identifying Market Leaders with Relative Strength
The eighth criterion focuses on Relative Strength (RS), which must be at least 70, though 90 or higher is ideal. An RS Rating of 90 means the stock has outperformed 90% of other stocks over the past 12 months [1]. As Minervini explains:
"Stock market leaders usually have Relative Strength Rating of 90 or higher at the early stage of their major moves." [1]
Stocks with rising RS values - like moving from 75 to 92 - signal accelerating performance and leadership. On the other hand, a declining RS, even from a high level like 95 to 82, suggests the stock is losing momentum despite a high price [1].
To find the strongest performers, compare RS scores of stocks within the same sector. This helps identify companies attracting the most institutional interest [7]. Setting price alerts near 52-week high pivot points ensures you can act quickly on breakout opportunities for stocks that meet both the RS and Trend Template criteria [1].
The number of stocks passing the Trend Template also reflects the broader market's health. When 30 to 50+ stocks qualify, it indicates a bullish environment where active trading across sectors is viable. If only 0 to 5 stocks qualify, it suggests a challenging market where preserving capital and holding cash is wise [1]. As Minervini puts it:
"I don't really do a whole lot of general market analysis. I look at the price and volume of the market. 90% of my work is all stock work. If there's a lot of stocks then I'm bullish on the market." [1]
Once uptrends are confirmed, the next step is identifying volatility contraction patterns for further analysis.
Step 2: Find Stocks with Volatility Contraction Patterns
Once you've filtered stocks using the Trend Template, the next step is spotting Volatility Contraction Patterns (VCPs). This chart pattern signals a shift from retail selling to institutional buying. Think of it like a compressed spring - each tightening consolidation reflects decreasing selling pressure, setting the stage for a potential breakout.
VCPs only appear during confirmed Stage 2 uptrends. This means the stock should already be trading above its 50-day, 150-day, and 200-day moving averages. The pattern typically features 2 to 6 pullbacks, with each successive drop becoming smaller. This shrinking pattern indicates sellers losing momentum, creating well-defined entry points for traders.
The historical significance of VCPs is undeniable. Over half of stocks that double in price within a year show VCP patterns during their base-building phases [10]. When major indices are above their monthly 10-period exponential moving averages, VCP breakouts succeed 90.77% of the time [9]. Additionally, 60% to 70% of VCP breakouts lead to strong price rallies when accompanied by higher trading volume [10].
What Makes a VCP
In Minervini’s strategy, a well-formed VCP is a clear signal for entry. A valid VCP follows specific technical rules. The pullbacks must become progressively smaller, adhering to the "half-rule", where each contraction is roughly 50% shallower than the last. For example, an initial 20% drop might be followed by a 10% pullback, then 5%. This tightening effect creates what Minervini refers to as a "pressure cooker."
Volume plays a critical role. Each pullback should show a sharp volume decrease - often 40% to 60% below the 50-day average during the final contraction. This indicates that sellers are running out of steam. The pivot point - the highest price during the last, tightest contraction - becomes the entry trigger. Traders typically set buy-stop orders 1% to 2% above this level, ensuring they only enter on confirmed momentum [2][12].
Examples of successful VCPs include Shopify (SHOP) in 2016. After an initial surge, the stock formed smaller pullbacks on declining volume. Once it broke through the pivot point, it gained nearly 200% over the next year [13]. Similarly, Tesla (TSLA) displayed a three-month VCP in 2020, followed by a high-volume breakout that led to a 90% price increase [13].
Minervini highlights the power of VCPs:
"When you quiet the stock down and it gets very tight on that right side after contracting and the volume comes in, that's telling you that stock supply has stopped coming to market. That's why they're so explosive when they come out of these formations." [9]
Confirming Breakouts with Volume and Accumulation
Volume analysis is key to distinguishing successful breakouts from failed ones. The difference lies in institutional involvement. A breakout should show a volume surge of 40% to 50% above the daily average [9][2]. This confirms that institutions, not just retail traders, are driving the move. Without this volume spike, breakouts often fail, and prices retreat.
To improve risk-reward ratios, enter within 5% of the pivot point. This approach offers returns that are 40% better [2]. To protect against losses, place a stop-loss just below the lowest point of the final contraction, keeping risk limited to 7% to 8% [2][12][10]. This strategy ensures quick exit if the pattern fails while preserving upside potential.
Look for stocks showing 3 to 5 days of extremely low volume and minimal price movement during the final contraction - this calm often signals an imminent breakout [2]. Prioritize stocks with a Relative Strength rating of at least 70, though 90 or higher is ideal for focusing on market leaders [9][2].
Minervini underscores the role of institutional buying in successful breakouts:
"The difference between a breakout that pops out and comes back versus one that works is the difference between retail buying and institutional buying." [9]
With VCPs identified, the next step involves combining these technical signals with fundamental analysis to refine entry timing.
Step 3: Combine Fundamental Analysis with SEPA Entry Points
When it comes to stock trading, technical patterns help pinpoint the right moment to act, while fundamentals reveal the reasons behind a stock's performance and growth potential. SEPA, or Specific Entry Point Analysis, works by aligning four key factors: technical trend, earnings strength, price action, and a catalyst. This approach helps separate short-lived breakouts from stocks with long-term growth potential. In fact, research shows that 75% of major stock market winners had quarterly earnings growth exceeding 20% before their biggest price increases [2].
To refine your strategy, combine high-quality fundamentals with technical pivot points. This pairing ensures that your decisions are based on both a solid foundation and precise timing.
Evaluating Earnings and Revenue Growth
Strong fundamentals are the driving force behind sustained stock price increases. A good starting point is to look for quarterly EPS (earnings per share) growth of 20% to 25% year-over-year, though standout stocks often show growth of 40% to 50% or more [1][3]. Pay close attention to acceleration - this quarter's growth rate should outperform the previous one. For example, if last quarter's growth was 20%, aim for 25% or higher this quarter.
Revenue growth is just as critical. It confirms that earnings aren't being inflated by temporary measures like cost-cutting. Look for at least 15% quarterly revenue growth year-over-year, though 25% or higher is even better [1][3]. Keep an eye on profit margins - rising gross, operating, and net margins signal strong pricing power and operational efficiency. Additionally, a Return on Equity (ROE) above 17% indicates that management is effectively using capital [1][4].
One rare but powerful setup to watch for is the "Code 33 Alert." This occurs when EPS, revenue, and profit margins all accelerate for three consecutive quarters [5]. Institutional ownership is another important factor - stocks with 30% to 70% institutional backing strike a balance between professional support and room for growth [1][3]. Finally, identify a catalyst, like a new product launch, regulatory approval, or a major contract win, to understand the narrative behind the stock's breakout [3][4].
Once you've confirmed the fundamentals, the next step is timing your entry.
Timing Entries with SEPA
For a successful trade, both technical signals and strong fundamentals need to align. The pivot point - the resistance level at the final, tightest contraction in a VCP (Volatility Contraction Pattern) - is the ideal entry point. Wait for the stock to break through this level on volume that's 40% to 50% above the daily average [3][4]. This volume spike indicates institutional buying rather than retail-driven speculation.
To manage risk, set stop-losses 7% to 8% below your entry price [3][4]. Before entering, make sure major indices are trading above their monthly 10-period exponential moving averages - 90.77% of successful breakouts happen during these favorable market conditions [1][3]. If your trades are performing well, consider increasing your position size. However, if they hit stop-loss levels, reduce your exposure, even if the stock's fundamentals seem strong [4].
Here’s a quick reference for key metrics to guide your analysis:
| Metric | Minimum Requirement | Preferred Standard |
|---|---|---|
| Quarterly EPS Growth | 20% - 25% YoY | 40%+ YoY |
| Quarterly Revenue Growth | 15% YoY | 25%+ or accelerating |
| Profit Margins | Stable | Expanding quarter-over-quarter |
| Return on Equity (ROE) | 17% | Higher indicates efficiency |
| Institutional Ownership | 30% | 30% - 70% range |
| Relative Strength (RS) | 70 | 90+ for market leaders |
Step 4: Manage Risk with Position Sizing
In line with the Minervini Method's focus on safeguarding capital, getting position sizing right is absolutely critical. Even the best trade setups can fail without a solid risk management plan.
Setting Dollar Risk Per Trade
The idea here is straightforward: limit your risk to just 1% to 2% of your total account equity per trade[3][4][14]. This strategy helps protect your capital during losing streaks. For example, with a $100,000 account and a 1% risk threshold, you’re risking $1,000 per trade. This approach means you could endure over 50 consecutive losses without wiping out your account. Compare that to risking 10% per trade - you’d only survive 5 or 6 losses before running out of funds[15].
Why is this important? Recovering from large losses is much harder than avoiding them in the first place. For this reason, Minervini enforces a strict maximum stop-loss of 7% to 8% of the purchase price[3][4]. However, his typical stop-losses are even tighter, usually between 4% and 6%[4]. To figure out your position size, divide your dollar risk by the percentage distance between your entry price and stop-loss. For instance, if you’re risking $1,000 and your stop-loss is 5% away, you can afford a $20,000 position[14].
"The best traders aren't afraid to take risks; they are afraid of taking the wrong risks." - Mark Minervini[14]
Once your dollar risk is set, the next step is to protect it by carefully placing stop-losses.
Placing Stop-Losses for Protection
Tight stop-losses are key to minimizing losses while allowing for larger position sizes without increasing risk. This strategy played a big role in Minervini's 334% return during the 2021 U.S. Investing Championship[16]. The process starts with calculating your exit points before entering a trade[14][15]. Using buy-stop limit orders can help you enter at breakout levels while avoiding overpaying during sudden price spikes[11].
A good rule of thumb? Once a stock gains twice your initial risk (2R), move your stop-loss to breakeven. This ensures your capital is protected while still allowing the trade to grow[16][11].
Managing Total Portfolio Exposure
Beyond managing risk per trade, it’s equally important to control your overall portfolio exposure. Minervini’s approach builds exposure gradually, based on how trades are performing, rather than relying on arbitrary allocation targets[5][16]. He focuses on 4 to 8 high-conviction stocks instead of spreading capital thin across dozens of positions[4][1].
"Everything that guides us, whether we get aggressive or not, is all based on our own trades working. Doesn't matter the whole world could be doing well, if our trades aren't working we're not increasing size." - Mark Minervini[4]
Start with small test positions to gauge market conditions. If these trades perform well, you can increase your exposure. If they hit stop-losses or show weakness, scale back and hold more cash[16][3]. To mitigate risk, no single position should make up more than 25% of your total trading capital, as this helps protect against sudden, large losses from gap-downs[11].
When the market environment is weak - indicated by fewer stocks meeting the Trend Template (e.g., 0 to 5 stocks) - it’s often better to stay in cash[1][4]. By sticking to disciplined risk management, you not only protect your portfolio but also set yourself up for success in the next phase: knowing when to exit and take profits.
Step 5: Exit Trades and Take Profits
Knowing how and when to exit trades is just as important as choosing the right time to enter. A well-timed exit can protect your profits and limit losses, ensuring long-term success. The Minervini Method emphasizes the importance of treating exits with the same precision as entries to safeguard your capital and maximize gains on winning trades.
Taking Partial Profits at Target Levels
A disciplined approach to exits helps secure profits while keeping losses in check. One effective strategy is to sell part of your position when it hits a predetermined profit target, allowing the rest to ride with a trailing stop. For example, you could sell half your position at 2R (twice your initial risk) and then move your stop-loss to breakeven. This locks in gains while giving you the chance to capture further upside.
Take MicroStrategy (MSTR) as an example: the stock soared 100% in just 13 trading days, presenting a perfect opportunity to secure profits. When setting profit targets, aim for a risk-reward ratio of at least 3:1 - this means for every dollar you risk, you should aim for at least three dollars in potential gains [11][17].
"The secret to successful trading lies not just in selecting the right stocks but also in understanding when to sell them." – Mark Minervini [17]
Cutting Losses Quickly
If a trade hits your stop-loss, exit without hesitation. Look for technical warning signs like high-volume sell-offs, bearish reversal patterns, or significant breaks below key moving averages. If the reasons behind your trade - whether technical or fundamental - no longer hold, it’s better to exit immediately rather than waiting for the stop-loss to be triggered.
Additionally, if major indices fall below key moving averages or top-performing stocks drop to 0–5 on a qualified list, it’s a signal to exit and preserve your capital [1][3]. This disciplined exit strategy underscores the Minervini Method's focus on proactive risk management and maximizing reward potential.
Running NinjaTrader on TraderVPS

For traders using the Minervini Method, reliable and uninterrupted trading is non-negotiable. This method relies heavily on precise timing for entry and exit orders, something that local setups can’t always guarantee. TraderVPS solves this problem by hosting NinjaTrader on servers that run 24/7. This ensures your stop-loss orders remain active and your VCP (Volatility Contraction Pattern) alerts stay operational - even if you're away from your desk. This dependable setup is critical for seamless trade execution, keeping your strategy on track without interruptions.
TraderVPS Plans for Active Traders
TraderVPS offers plans tailored to meet the demands of Minervini-style trading, ensuring you have the power and reliability needed for success:
- VPS Pro: $99/month – Includes 6 AMD EPYC cores, 16GB DDR4 RAM, and 150GB NVMe storage. This plan supports 3–5 charts simultaneously while scanning thousands of stocks for Trend Template criteria and VCP patterns.
- VPS Ultra: $199/month – Features 24 AMD EPYC cores, 64GB DDR4 RAM, and 500GB NVMe storage. Ideal for 5–7 charts with multi-monitor setups, it can handle larger watchlists and intensive backtests with ease.
These plans utilize top-tier multi-core processors and PCIe Gen4 NVMe SSDs, offering read speeds of up to 7,000 MB/s. This ensures fast data access and smooth operation, even under heavy workloads.
Features That Support Consistent Trading
TraderVPS guarantees 99.999% uptime, shielding you from disruptions caused by local power outages or system failures. With sub-0.52ms latency to CME Group matching engines via direct fiber-optic cross-connects, the platform ensures that SEPA entries are executed with minimal slippage - crucial for adhering to the Minervini Method's strict stop-loss requirements.
"Lightning-fast latency is essential for swift futures trade execution and reducing slippage." – TraderVPS [18]
Security is another key feature. Enterprise-level DDoS protection and encrypted Remote Desktop Protocol (RDP) ensure safe access from any device, whether you're using a PC, Mac, iOS, or Android. Plus, the servers come pre-installed with Windows Server 2022, fully optimized for trading platforms. This eliminates setup headaches, allowing you to focus on identifying the next breakout stock. By minimizing execution risks, TraderVPS aligns perfectly with the technical precision and risk management principles of the Minervini Method.
Conclusion
The Minervini Method thrives because it’s systematic, not subjective. By using the Trend Template, you zero in on Stage 2 leaders already in confirmed uptrends [1][3]. Adding the Volatility Contraction Pattern (VCP) ensures that you're entering positions where institutional buying is evident. When paired with strong fundamentals - like earnings growth of 20% or more - and disciplined risk management, this approach creates an edge: risking 7–8% for the potential to gain 20–30% or more [3].
What sets successful traders apart is discipline. As Mark Minervini himself puts it:
"If you lose on a trade, it's because you missed something. Either the market, the stock, it wasn't set up properly, something you missed because when you do it right it works perfect" [4].
This highlights the importance of following every step. Skipping even one - like volume confirmation or verifying Stage 2 - can dramatically reduce your success rate [2][4].
Interestingly, research shows that nearly 90.77% of successful breakouts occur during bullish market conditions, when major indices trade above their monthly 10-period EMAs [3][4]. Fully adhering to all seven VCP criteria boosts win rates by 40% compared to partial application [2]. Minervini himself demonstrated the power of this strategy, achieving an average annual return of 220% over five years [3].
For traders using the best futures trading platforms like NinjaTrader, reliability is crucial. Tools like TraderVPS, offering 99.999% uptime and ultra-low latency, help ensure stop-losses trigger without delay and VCP alerts remain active around the clock. This reliability is key when working with tight stops and precise entries.
Ultimately, the Minervini Method isn’t about predicting what’s next - it’s about being prepared. By sticking to a repeatable process, focusing on quality setups, and managing risk with precision, you can consistently stack the odds in your favor [5].
FAQs
How do I know a stock is truly in Stage 2?
A stock enters Stage 2 when it demonstrates a clear and sustained uptrend. Here are the key indicators to look for:
- The stock's price stays above both the 150-day and 200-day moving averages.
- The 150-day moving average is positioned above the 200-day moving average, with both trending upward for at least 22 days.
- The stock is trading at least 30% higher than its 52-week low and remains within 25% of its 52-week high.
These signals collectively point to a robust bullish trend.
What if a VCP breakout happens without a big volume surge?
When a VCP breakout happens without a noticeable surge in volume, it could indicate a weaker move with a greater chance of failing. Volume plays a crucial role in validating the breakout's strength and gauging institutional interest. It's important to evaluate the broader context of the breakout and weigh other factors carefully before deciding on any trades.
How do I size a position if my stop is only 4% to 6% away?
To determine position size using the Minervini Method, start by calculating how much capital you're comfortable risking.
- Step 1: Choose your maximum risk per trade, typically between 1% and 2% of your total capital.
- Step 2: Multiply your total capital by this percentage to find your dollar risk.
- Step 3: Divide your dollar risk by the stop-loss amount per share. This calculation gives you the number of shares to purchase, keeping your risk in check.
This approach helps you manage losses effectively while staying disciplined.


